
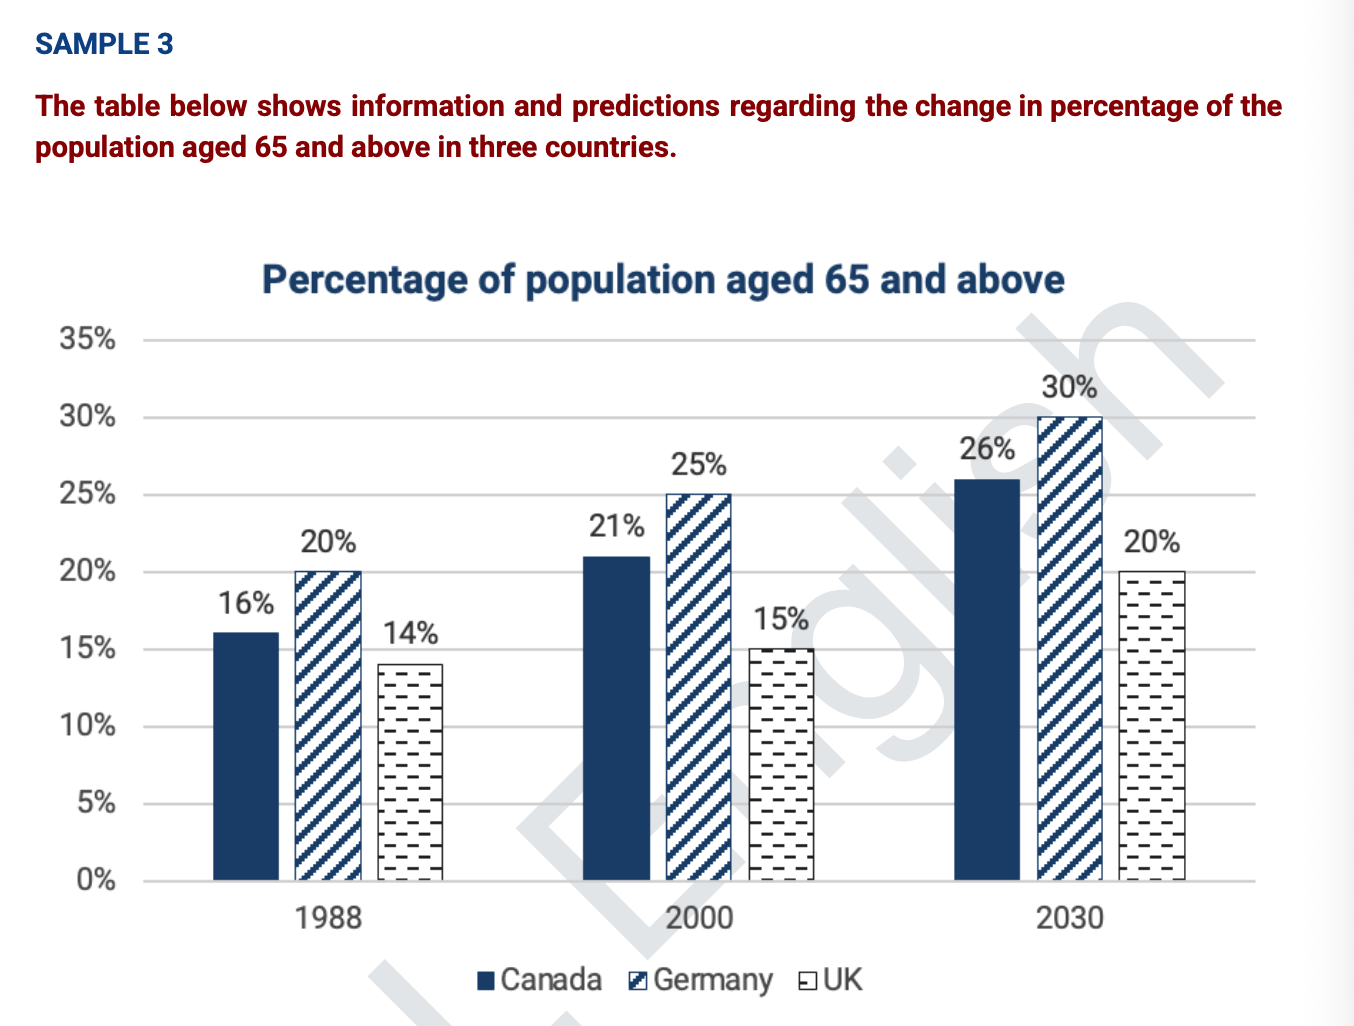
The statistics illustrate the proportion of people aged 65 and above varied in three distinct countries over a 48-year period, starting from 1988, with projections up to 2030. Overall, all three countries witnessed ascending trends in the percentage of population aged 65+, with a projected rise by 2030. Among these countries, Germany secured the top position from 1988 to 2000 and predicted to maintain its position for the following 30 years. In 1988, in first place was Germany, whose percentage of people aged 65+ stood at 20%, 4 percentage points higher than the figure for Canada. This was closely followed by UK, with 14% of population aged 65 and above. Afterwards, Germany and Canada observed a steady increase in the proportion of people aged 65 and above, at 25% and 21% respectively in 2000. Thereafter, these figures are expected to increase 5 percentage points by 2030. Meanwhile, the percentage of population aged 65 and above grew slightly by 1 percentage point between 1988 and 2000. In 2030, it is forecast that UK will record a significant rise to 20%.
Sample Detail
The table below shows information and predictions regarding the change in percentage of the population aged 65 and above in three countries
20/07/2026 07:05 7.0 points
Topic
The table below shows information and predictions regarding the change in percentage of the population aged 65 and above in three countries
Word count: 179
Chart/Graph
Essay
Overall Scores
7.0±0.5
Good
Writing Criteria Scores
TA7.0
CC7.0
LR7.0
GRA7.0
Click on any highlighted text in the essay to view detailed suggestions for improvement.
Deep Analysis
Task 1 - Academic Writing
4 tools available
Sample Essay - IELTS Writing Task 1
No sample essay
Click the button below to analyze and generate a high-quality sample essay for Task 1.