
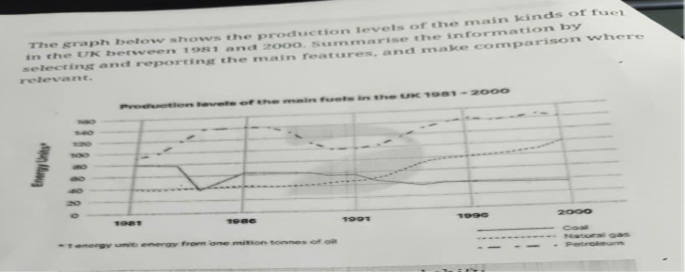
The line graph illustrates the production levels of three main types of fuel—petroleum, coal, and natural gas—in the UK between 1981 and 2000. Overall, it is clear that while the production of petroleum and natural gas followed an upward trend, coal production was down directly. Petroleum consistently remained the most produced fuel over a period. In 1981, petroleum was the highest, with 90 energy units produced. This was followed by coal at 80 units. While natural gas accounted for only 40 units, which was less than half of the petroleum output. Regarding the trends, petroleum production fluctuated before generally increased, even reached 140 energy units by 2000, remain it position as the highest-ranked fuel. Natural gas was a steady increase over the decades, rose to 100 energy units by 2000. Have allowed it to overtake coal and become the second most produced fuel. In contrast, coal production showed a downward trend after 1981, a low of approximately 35 energy units by the last of the period.
नमूना विवरण
The graph below shows the production levels of the man kinds of fuel in the UK between 1981 and 2000
20/07/2026 07:14 6.5 अंक
विषय
The graph below shows the production levels of the man kinds of fuel in the UK between 1981 and 2000
शब्दों की संख्या: 166
चार्ट/ग्राफ
Essay
समग्र स्कोर
6.5±0.5
ठीक
राइटिंग मानदंड स्कोर
TA7.0
CC7.0
LR6.0
GRA6.0
सुधार के विस्तृत सुझाव देखने के लिए लेख में किसी भी हाइलाइट किए गए टेक्स्ट पर क्लिक करें।
गहन विश्लेषण
Task 1 - Academic Writing
4 उपकरण उपलब्ध
नमूना लेख - IELTS Writing Task 1
कोई नमूना लेख नहीं
Task 1 के लिए उच्च-गुणवत्ता वाला नमूना लेख विश्लेषण और बनाने के लिए नीचे दिए गए बटन पर क्लिक करें।