
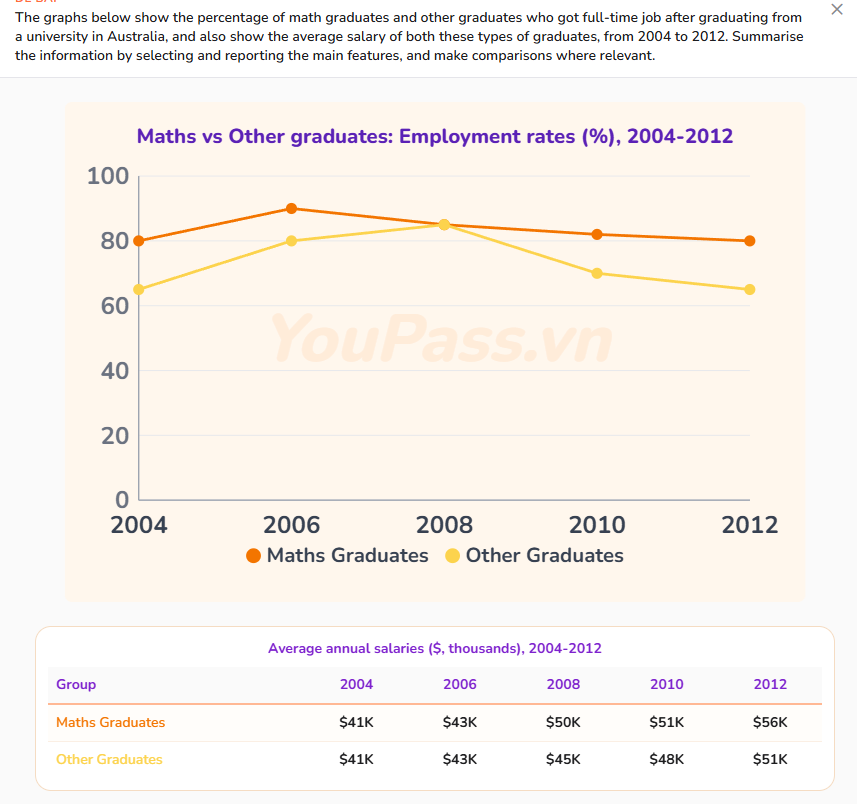
The given line graph and table illustrate the proportion of employment rates and average salaries of Maths graduates and graduates from other fields in Australia between 2004 and 2012. Overall, it is evident that there was a noticeable fluctuation in the employment rates of both groups over the period, while the average salaries increased consistently for both categories, with Maths graduates recording higher pay from 2008 onwards. In terms of employment data, the figure for math graduates accounted for 80% in full-time employment in 2004, compared to 65% of other graduates. Additionally, the percentage of employed maths graduates rose moderately to a peak of about 90% in 2006, before this figure witnessed a steadiy decrease to approximately 80% by 2012. Furthermore, a similar pattern was recorded among graduates from other fields, whose employment rate climbed gradually to just over 80% in 2006, then reached the highest level of 85% in 2008, and subsequently fell back to around 65% at the end of the period. Ragarding average salaries, both groups recorded an identical figure of $41K in 2004, which experienced a slightly increase to $43K in the following two years. From 2008 onwards, the salaries of maths graduates was higher rather than the figure for other graduates, with their avarage income rising from $50K in 2008 to $56K in 2012. Meanwhile, other graduates saw smaller growth, from $45K to just about $51K over the same period, creating a gap of roughly $5K by the final year.
รายละเอียดตัวอย่าง
The graphs below show the percentage of math graduates and other graduates who got full-time job after graduating from a university in Australia, and also show the average salary of both these types of graduates, from 2004 to 2012. Summarise the information by selecting and reporting the main features, and make comparisons where relevant.
20/07/2026 07:23 7.0 คะแนน
หัวข้อ
The graphs below show the percentage of math graduates and other graduates who got full-time job after graduating from a university in Australia, and also show the average salary of both these types of graduates, from 2004 to 2012. Summarise the information by selecting and reporting the main features, and make comparisons where relevant.
จำนวนคำ: 245
แผนภูมิ/กราฟ
Essay
คะแนนรวม
7.0±0.5
ดีมาก
คะแนนเกณฑ์การเขียน
TA7.0
CC7.0
LR7.0
GRA7.0
คลิกข้อความที่ไฮไลต์ในเรียงความเพื่อดูคำแนะนำรายละเอียดเพื่อพัฒนา
การวิเคราะห์เชิงลึก
Task 1 - Academic Writing
4 tools available
บทความตัวอย่าง - IELTS Writing Task 1
ยังไม่มีบทความตัวอย่าง
กดปุ่มด้านล่างเพื่อวิเคราะห์และสร้างบทความตัวอย่างคุณภาพสูงสำหรับ Task 1