
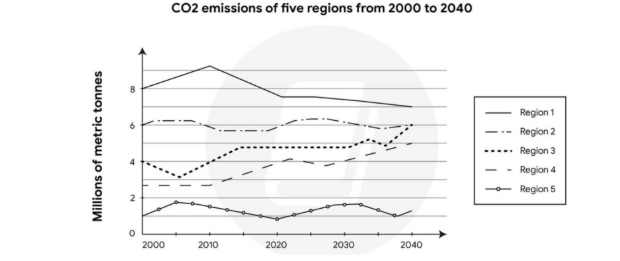
The line graph illustrates how the amount of CO2 emissions of five different regions changed between 2000 and 2020, and being forecasted up to the year 2040, measured in millions of metric tonnes. Overall, region 1 has been, and is forecasted to remain the largest CO2 emitter, while that of region 5 has consistently the lowest emitting region. It is also noteworthy that region 3 and region 4 are anticipated to increase over the period. Looking first at region 1, this region had the largest amount of CO2 emission in 2000, at 8 million tonnes, before rising to over 10 million 10 year later. However, this figure decreased significantly to around 7.5 million in 2020 and is projected to continue falling to just 7 million in 2040. Despite showing a downward trend, the region 1 will remain the biggest emitter among the five regions. Regarding region 3 and 4, both are expected to increase throughout the period. Emissions in region 3 climbed from 4 million in 2000 to just under 5 million in 2015, despite a slight drop in 2005. This figure remained unchanged until 2020 before being projected to reach 6 million tonnes in 2040. Similarly, the level of CO2 emission in region 4 stayed at 2.8 million initially, but it is anticipated to increase gradually to 5 million in the final year. In terms of region 2 and 5, both experienced a fluctuation, region 2 hovered at around 6 million and is predicted to match the figure of region 3 in 2040. Meanwhile, the region 5 fluctuated more considerably between 1 million and 1.8 million and is expected to release the least CO2.
Sample Detail
The graph below shows the CO2 emissions of five regions from 2000 to 2020, and predicted to up the year 2040
20/07/2026 07:25 6.0 points
Topic
The graph below shows the CO2 emissions of five regions from 2000 to 2020, and predicted to up the year 2040
Word count: 275
Chart/Graph
Essay
Overall Scores
6.0±0.5
Fair
Writing Criteria Scores
TA6.0
CC7.0
LR6.0
GRA6.0
Click on any highlighted text in the essay to view detailed suggestions for improvement.
Deep Analysis
Task 1 - Academic Writing
4 tools available
Sample Essay - IELTS Writing Task 1
No sample essay
Click the button below to analyze and generate a high-quality sample essay for Task 1.