
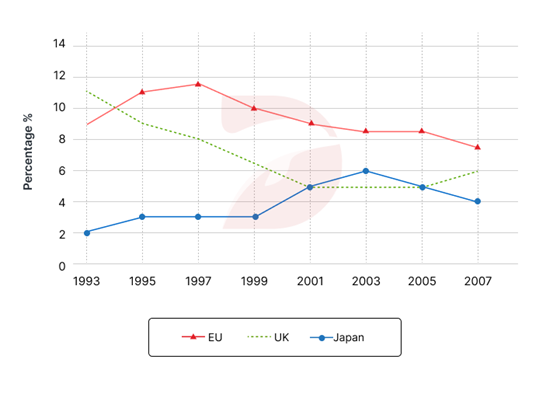
The line graph illustrates the data about the unemployment percentages for the United Kingdom, the other countries and regions in the Europe and Japan in the years 1993 to 2007. Overall, Japan and other regions show a contrasting pattern in which the figure of Japan increased while the others decreased. The European countries recorded the highest rate for almost the entire period except the year 1993 when the UK holds the dominant place. At the start of the period, the UK had the highest figure among all the regions with around 11% of the population was unemployed. It was followed by Europe with 9%, which was more than four times that of Japan at just 2% of unemployment. Thereafter, the unemployment proportion of the UK collapsed to 5% in 2001. It remained static to 2005 until grew up again to 6% in 2007. Turning to Japan, it demonstrated the opposite changes which increased by 1% in 1995 and stabilized for 4 years, followed by a rise to 6% in 2003 and then fell down steadily to 4% in 2007. Meanwhile, the percentage of joblessness in Europe peaked in 1997 with approximately 12%, it witnessed a downward trend to 7% over the next decade; however, it still held the highest unemployment rate until the last year of the period.
Sample Detail
The graph below shows the unemployment rates for the United Kingdom, the rest of Europe, and Japan from 1993 to 2007
20/07/2026 07:40 6.5 points
Topic
The graph below shows the unemployment rates for the United Kingdom, the rest of Europe, and Japan from 1993 to 2007
Word count: 218
Chart/Graph
Essay
Overall Scores
6.5±0.5
Fair
Writing Criteria Scores
TA7.0
CC7.0
LR7.0
GRA6.0
Click on any highlighted text in the essay to view detailed suggestions for improvement.
Deep Analysis
Task 1 - Academic Writing
4 tools available
Sample Essay - IELTS Writing Task 1
No sample essay
Click the button below to analyze and generate a high-quality sample essay for Task 1.