
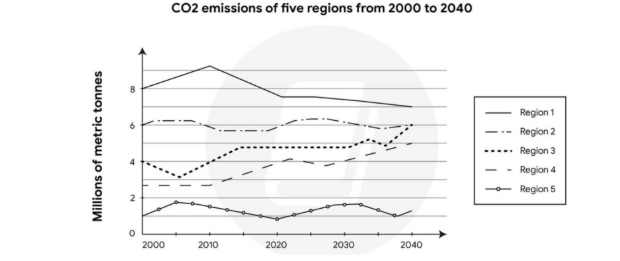
The given graph illustrates the CO2 emissions of five regions from 2000 to 2020, and predicted to up the year 2040. Overall the numbers of metric tones that had in region 1 was the highest in the timeframe, while region 5 got the lowest counts of metric tones in 4 decades. In recent decades, the numbers of metric tones in region 1 experienced a slightly increase and become a peak of the graph in 2010. After that CO2 emissions in region 1 plunge from approximately 9 to 7 in 2040. The numbers of CO2 emissions in region 3 dip slightly from 4 to 3 in 2005 and it ungone a steadily rise from 3 to 5 in 2040. Similary with region 3, the count of metric tones in region 4 climbed from about 3 to 5 in 40 years later. Unlike with region 1, 3, 4, the numbers of CO2 emissions in region 2 and 5 remain stable in 4 decades.
รายละเอียดตัวอย่าง
The graph below shows the CO2 emissions of five regions from 2000 to 2020, and predicted to up the year 2040
20/07/2026 08:32 5.0 คะแนน
หัวข้อ
The graph below shows the CO2 emissions of five regions from 2000 to 2020, and predicted to up the year 2040
จำนวนคำ: 161
แผนภูมิ/กราฟ
Essay
คะแนนรวม
5.0±0.5
พื้นฐาน
คะแนนเกณฑ์การเขียน
TA5.0
CC6.0
LR5.0
GRA5.0
คลิกข้อความที่ไฮไลต์ในเรียงความเพื่อดูคำแนะนำรายละเอียดเพื่อพัฒนา
การวิเคราะห์เชิงลึก
Task 1 - Academic Writing
4 tools available
บทความตัวอย่าง - IELTS Writing Task 1
ยังไม่มีบทความตัวอย่าง
กดปุ่มด้านล่างเพื่อวิเคราะห์และสร้างบทความตัวอย่างคุณภาพสูงสำหรับ Task 1