
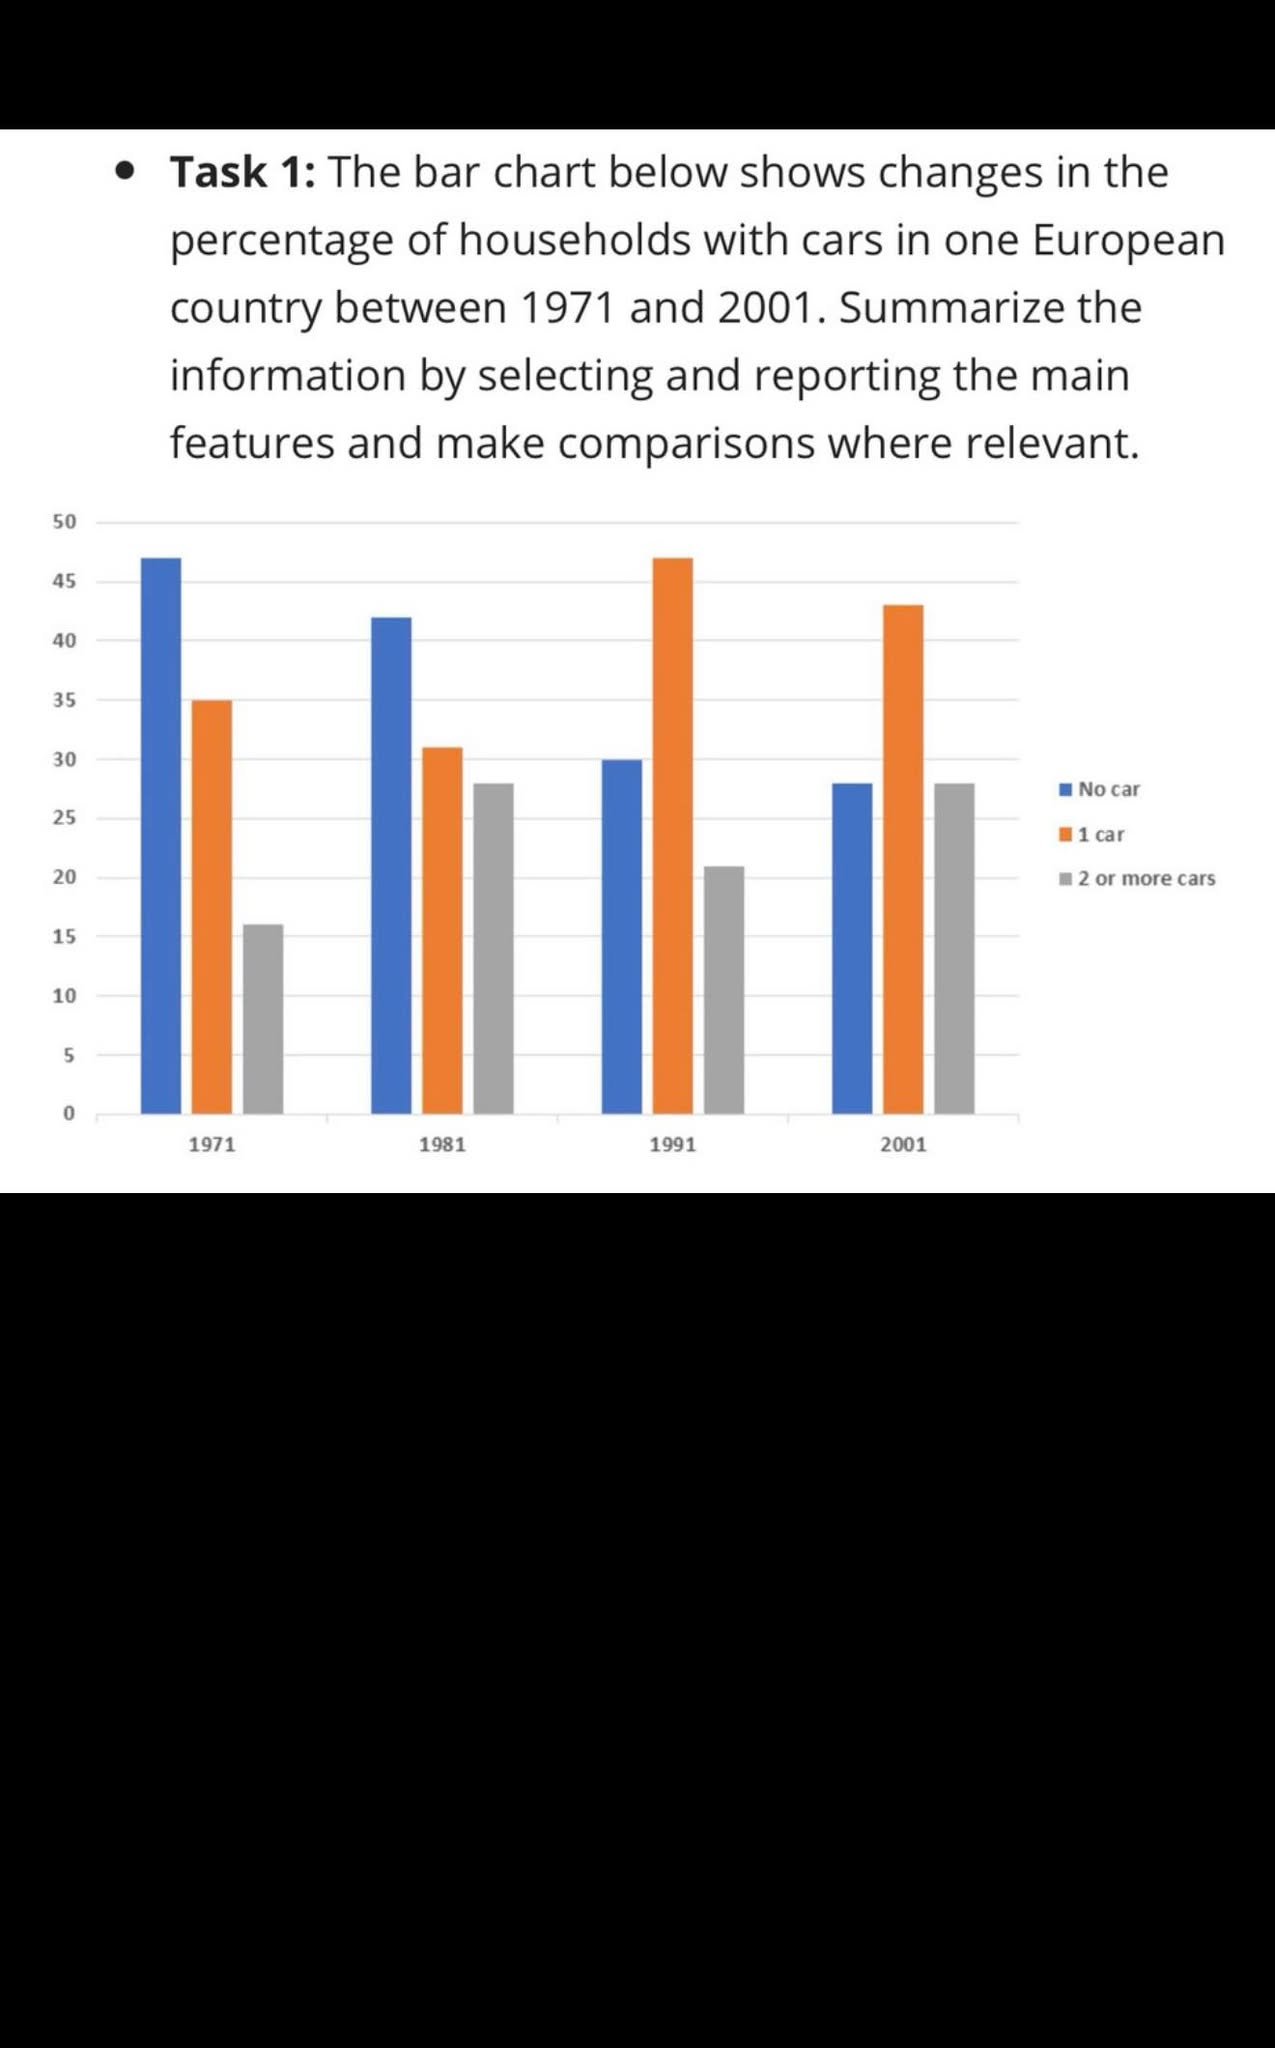
The bar chart illustrate that how many car was owned in each family in European country from 1971 to 2001. Overall, it is clear that group 2 or more cars had the lowest percentage in over first 20 years. In addition, in 1971 was witnessing the most decrease in 3 categories. Looking first at 1971, the highest figures was recorded in households with no car, at 47% followed by 1 car at 35% and bottomed out at 16% of 2 or more cars. Similarly, in 1981 the family which did not own any car was reached the peak at 43% and declined at 31% in 1 car and at 28% in 2 or more cars. Turning to 1991, the figures ranged from 47% in 1 car, 30% in no car and 21% in 2 or more car. Regarding 2001, the bar chart showed relatively similar percentages across all categories. There were 43% in 1 car, 29% in no car and 28% in 2 or more cars.
নমুনা বিস্তারিত
the bar chart below show changes in the percentage of households with cars in one European country between 1972 and 2001.
20/07/2026 08:39 5.5 স্কোর
টপিক বা বিষয়
the bar chart below show changes in the percentage of households with cars in one European country between 1972 and 2001.
শব্দ সংখ্যা: 166
চার্ট/গ্রাফ
Essay
সামগ্রিক স্কোর
5.5±0.5
প্রাথমিক
রাইটিং মানদণ্ড স্কোর
TA6.0
CC6.0
LR6.0
GRA5.0
উন্নতির জন্য বিস্তারিত পরামর্শ দেখতে প্রবন্ধের হাইলাইট করা যেকোনো লেখায় ক্লিক করুন।
গভীর বিশ্লেষণ
Task 1 - Academic Writing
4 tools available
নমুনা রচনা - IELTS Writing Task 1
কোনো নমুনা রচনা নেই
টাস্ক ১-এর জন্য উচ্চমানের নমুনা রচনা বিশ্লেষণ এবং তৈরি করতে নিচের বাটনে ক্লিক করুন।