
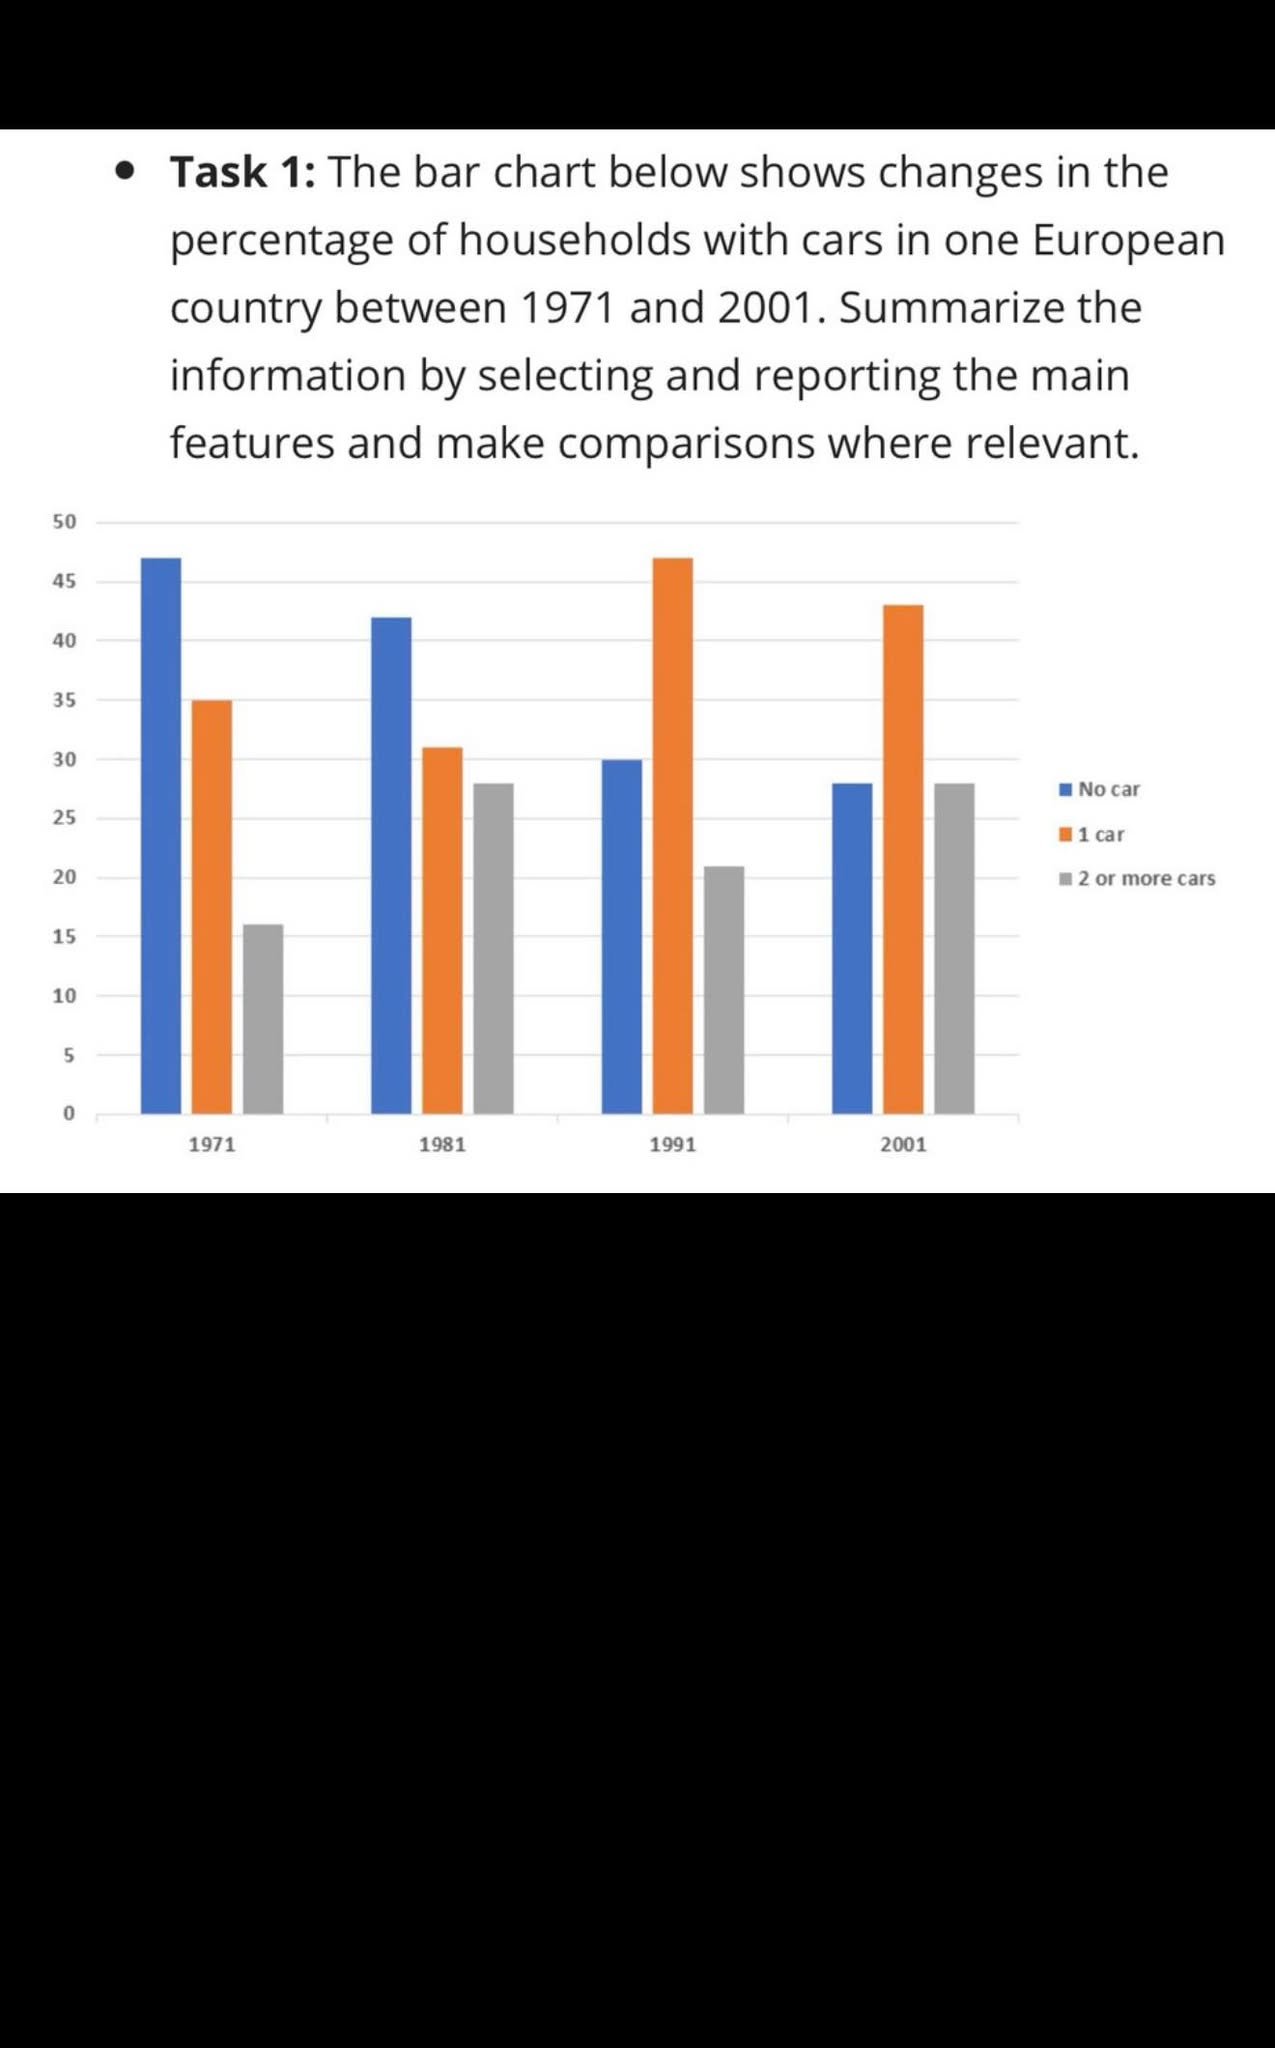
The bar chart illustrate that how many car was owned in each family in European country from 1971 to 2001. Overall, it is clear that group 2 or more cars had the lowest percentage in over first 20 years. In addition, in 1971 was witnessing the most decrease in 3 categories. Looking first at 1971, the highest figures was recorded in households with no car, at 47% followed by 1 car at 35% and bottomed out at 16% of 2 or more cars. Similarly, in 1981 the family which did not own any car was reached the peak at 43% and declined at 31% in 1 car and at 28% in 2 or more cars. Turning to 1991, the figures ranged from 47% in 1 car, 30% in no car and 21% in 2 or more car. Regarding 2001, the bar chart showed relatively similar percentages across all categories. There were 43% in 1 car, 29% in no car and 28% in 2 or more cars.
नमूना विवरण
the bar chart below show changes in the percentage of households with cars in one European country between 1972 and 2001.
20/07/2026 08:39 5.5 अंक
विषय
the bar chart below show changes in the percentage of households with cars in one European country between 1972 and 2001.
शब्दों की संख्या: 166
चार्ट/ग्राफ
Essay
समग्र स्कोर
5.5±0.5
बुनियादी
राइटिंग मानदंड स्कोर
TA6.0
CC6.0
LR6.0
GRA5.0
सुधार के विस्तृत सुझाव देखने के लिए लेख में किसी भी हाइलाइट किए गए टेक्स्ट पर क्लिक करें।
गहन विश्लेषण
Task 1 - Academic Writing
4 उपकरण उपलब्ध
नमूना लेख - IELTS Writing Task 1
कोई नमूना लेख नहीं
Task 1 के लिए उच्च-गुणवत्ता वाला नमूना लेख विश्लेषण और बनाने के लिए नीचे दिए गए बटन पर क्लिक करें।