
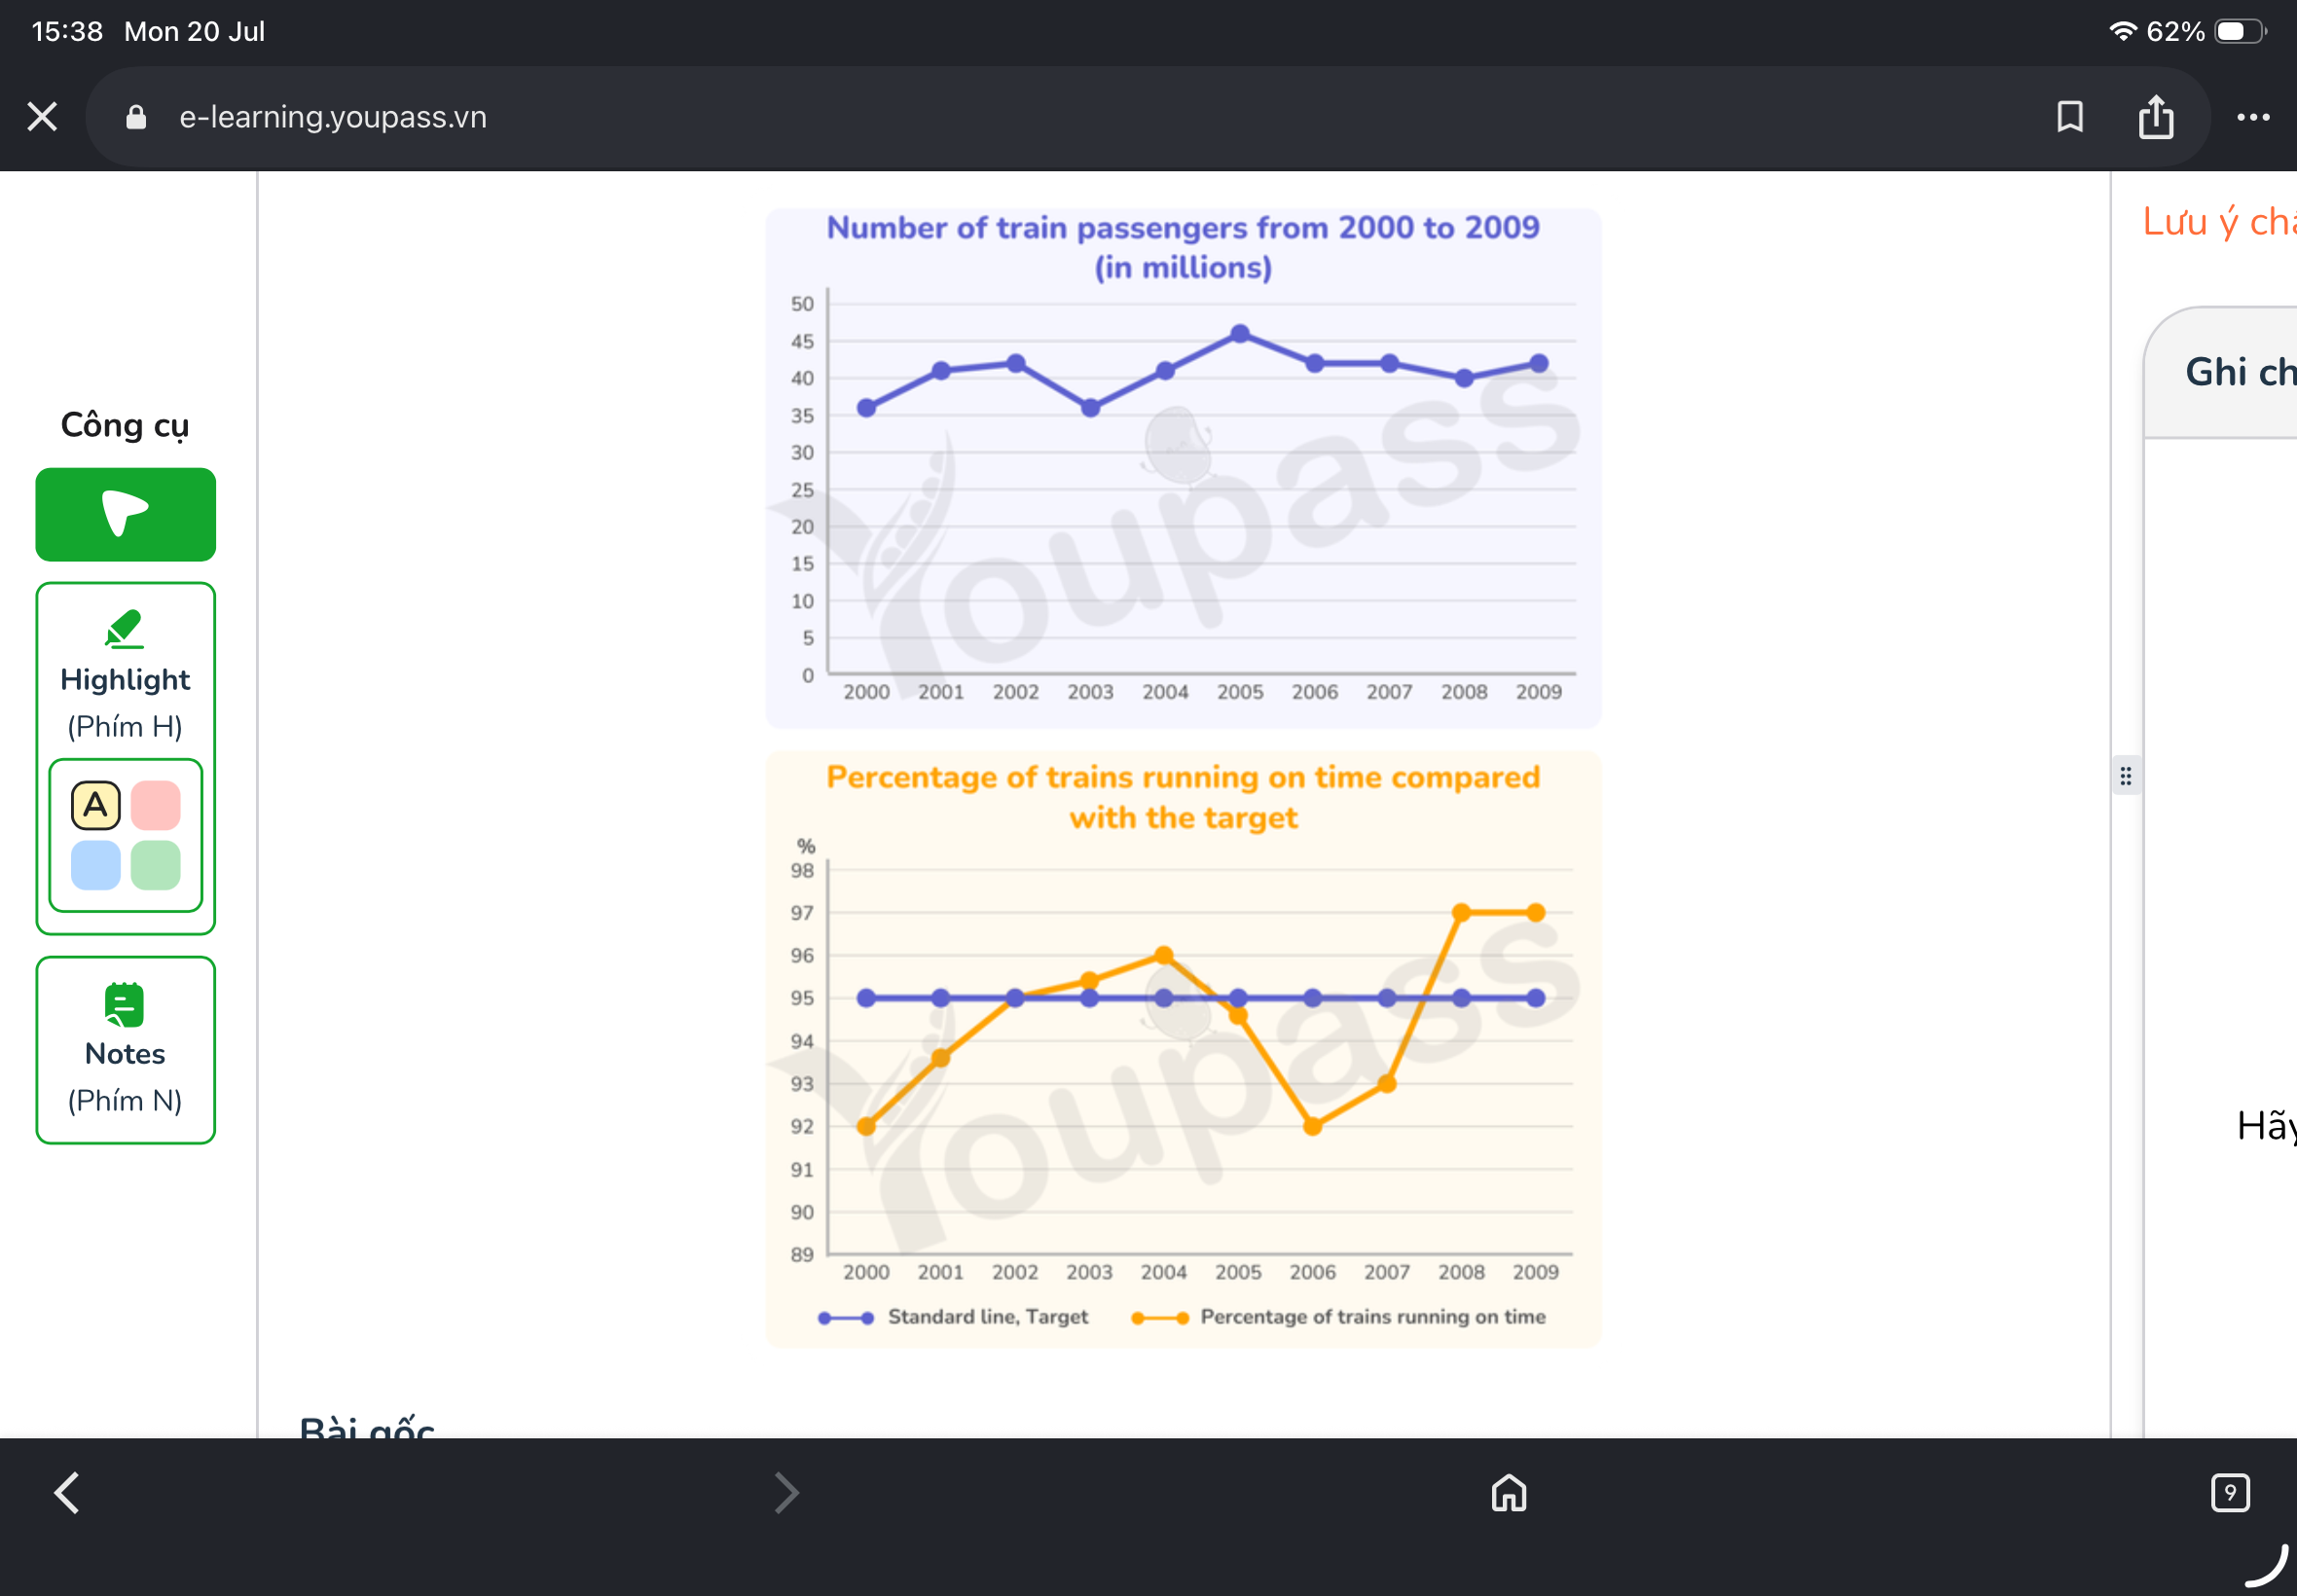
The two line graphs illustrate the number of train passengers and the proportion of trains running on schedule from 2000 to 2009. The passenger figures are given in millions, while the on-time performance is measured against a benchmark target of 95%. Overall, it is evident that while the number of train passengers exhibited a general upward trend despite minor fluctuations, the on-time performance was considerably more volatile. Notably, the train’s punctuality rate ended the period by meeting and exceeding the target, while passengers also surpassed their levels in initial figures. Focusing on the number of train passengers, the number of this category started at 35 millions in 2000 and increased to 41 millions in 2002, before dropping to 35 millions in 2003. However, after this point time, the number of train passengers peaked at 45 millions in 2005 and declined slightly to 41 millions in 2006, this figure remained relatively stable by the end of the period. Turning to the percentage of trains running on schedule, this figures were oscillated significantly over the time. The on-time performance started at 92% , before rising considerably and meeting the target at 95% in 2002. After this time, the proportion of this category rose consistently to 96% in 2004 and declined markedly to 92% in 2006. However, the percentage of the on-time performance improve significantly in the following years, notably this figure was exceeded the target, accounting approximately for 97%. After the target reaches its peak, it is maintained until the end of the period.
รายละเอียดตัวอย่าง
The first graph shows the number of train passengers from 2000 to 2009. The second graph shows the percentage of trains running on time. Summarise the information by selecting and reporting the main features, and make comparisons where relevant.
20/07/2026 08:39 6.5 คะแนน
หัวข้อ
The first graph shows the number of train passengers from 2000 to 2009. The second graph shows the percentage of trains running on time. Summarise the information by selecting and reporting the main features, and make comparisons where relevant.
จำนวนคำ: 252
แผนภูมิ/กราฟ
Essay
คะแนนรวม
6.5±0.5
ดีพอใช้
คะแนนเกณฑ์การเขียน
TA6.0
CC7.0
LR7.0
GRA6.0
คลิกข้อความที่ไฮไลต์ในเรียงความเพื่อดูคำแนะนำรายละเอียดเพื่อพัฒนา
การวิเคราะห์เชิงลึก
Task 1 - Academic Writing
4 tools available
บทความตัวอย่าง - IELTS Writing Task 1
ยังไม่มีบทความตัวอย่าง
กดปุ่มด้านล่างเพื่อวิเคราะห์และสร้างบทความตัวอย่างคุณภาพสูงสำหรับ Task 1