
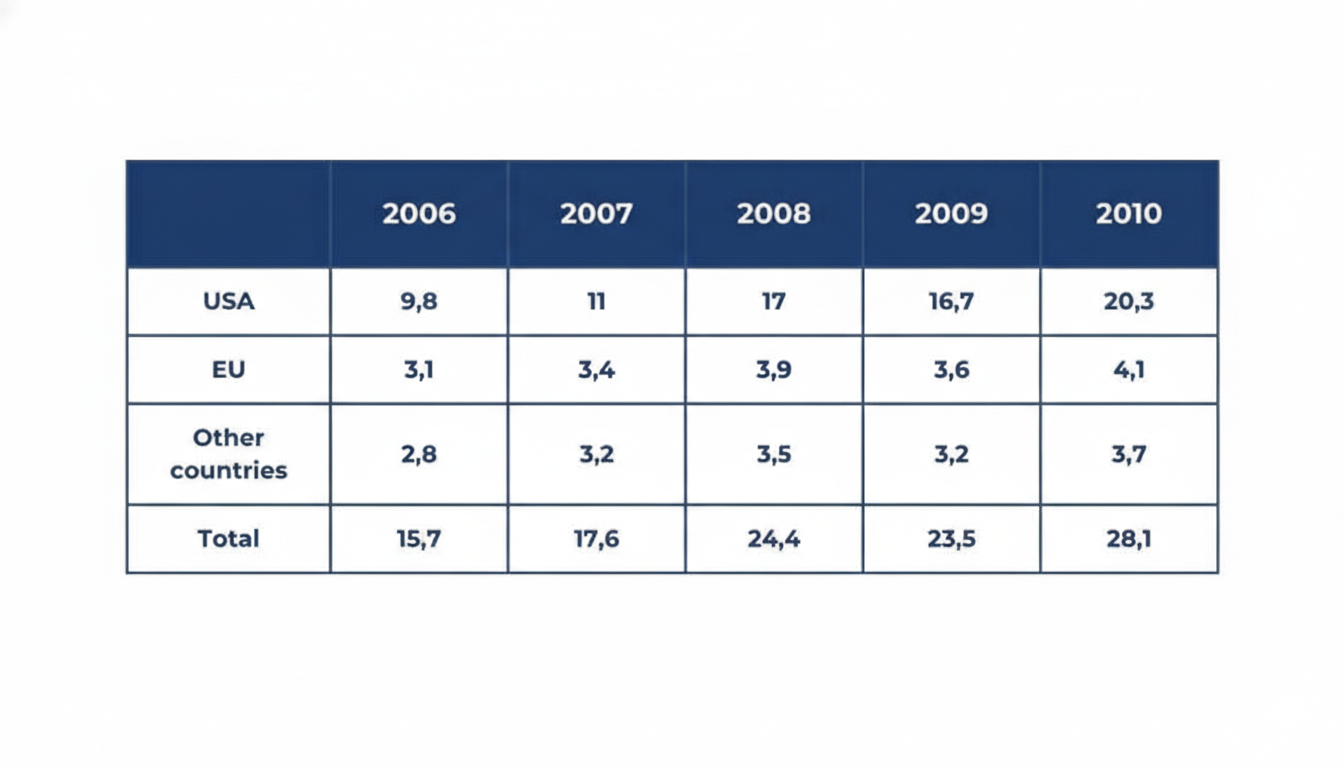
The table illustrates the spending on countries' development in millions of dollars by the USA, EU countries and other countries between 2006 and 2010. Overall, all figures witnessed a noticeable increase throughout the period with the exception in 2009 that experienced a modest decline before recovery again. The amount of money by the USA accounted for the highest compared to the EU contries and other countries. In 2006, the total amount of money stood at 15,7 million dollars, followed by the USA at 9,8 million dollars. The figure for the EU accounted for 3,1 million dollars compared to 2,8 million dollars by other countries. By 2007, the total figure experienced a gradual increase to 17,6 million dollors, which was 6,6 million dollars higher than that in the USA. The spending of the EU and other countries recorded 3,4 and 3,2 respectively. Turning to 2009, all the figures witnessed a noticeable decrease in the amount money. The total amount declined gradually to 23,5 million dollars while the USA decreased to 16,7 million dollars. Similarly, the data of the EU countries and other countries also experienced slight decrease to 3,6 and 3,2 million dollars, respectively. In the following year, there was a recovery back. The total amount of money increased dramatically to 28,1 compared to 20,3 million dollars from the USA. The EU spent 4,1 million dollars, whereas the other countries allocated 3,7 million dollars.
รายละเอียดตัวอย่าง
The table shows the amount of money given to developing countries by the USA, EU countries and other countries from 2006 to 2010 (Figures are in millions of dollars). Summarize the information be selecting and reporting the main features and make comparisons where relevant.
20/07/2026 08:40 6.5 คะแนน
หัวข้อ
The table shows the amount of money given to developing countries by the USA, EU countries and other countries from 2006 to 2010 (Figures are in millions of dollars). Summarize the information be selecting and reporting the main features and make comparisons where relevant.
จำนวนคำ: 233
แผนภูมิ/กราฟ
Essay
คะแนนรวม
6.5±0.5
ดีพอใช้
คะแนนเกณฑ์การเขียน
TA7.0
CC7.0
LR6.0
GRA6.0
คลิกข้อความที่ไฮไลต์ในเรียงความเพื่อดูคำแนะนำรายละเอียดเพื่อพัฒนา
การวิเคราะห์เชิงลึก
Task 1 - Academic Writing
4 tools available
บทความตัวอย่าง - IELTS Writing Task 1
ยังไม่มีบทความตัวอย่าง
กดปุ่มด้านล่างเพื่อวิเคราะห์และสร้างบทความตัวอย่างคุณภาพสูงสำหรับ Task 1