
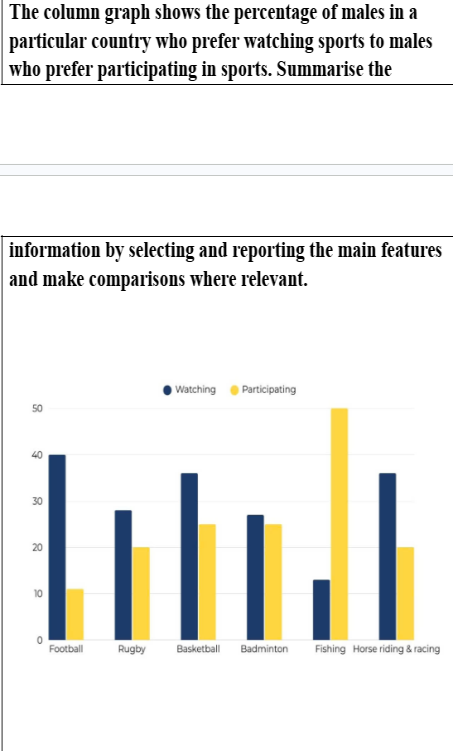
The column graph illustrates the proportion of men in a certain nation who were interested in watching sports compared to those who enjoyed playing them. Overall, the proportion of male individuals wanting to watch sport was higher than that of men taking part in them except for fishing. In addition, the figure for football accounted for the highest viewers, whereas fishing had the highest percentage of participants Regarding men who liked watching sports, standing at 40%, the ratio of football was 4% greater than that of basketball, horse riding & racing. Furthermore, the figure for rugby, which stood at 27%, was 1% higher than that of badminton compared to only 13% of fishing In terms of males choosing to play sports, there was 50% for fishing while the percentage for basketball and badminton reached 25%, followed by rugby and horse riding & racing recorded at 20%, which was 9% higher than that of football.
Detail Sampel
The column graph shows the percentage of males in a particular country who prefer watching sports to males who prefer participating in sports. Summarise the information by selecting and reporting the main features and make comparisons where relevant.
20/07/2026 08:47 7.0 skor
Topik
The column graph shows the percentage of males in a particular country who prefer watching sports to males who prefer participating in sports. Summarise the information by selecting and reporting the main features and make comparisons where relevant.
Jumlah kata: 154
Grafik/Diagram
Essay
Skor Keseluruhan
7.0±0.5
Baik
Skor Kriteria Writing
TA7.0
CC8.0
LR7.0
GRA7.0
Klik teks yang ditandai di esai untuk melihat saran detail untuk peningkatan.
Analisis mendalam
Task 1 - Academic Writing
4 tools available
Esai contoh - IELTS Writing Task 1
Belum ada esai contoh
Silakan klik tombol di bawah untuk menganalisis dan membuat esai contoh berkualitas tinggi untuk Task 1.