
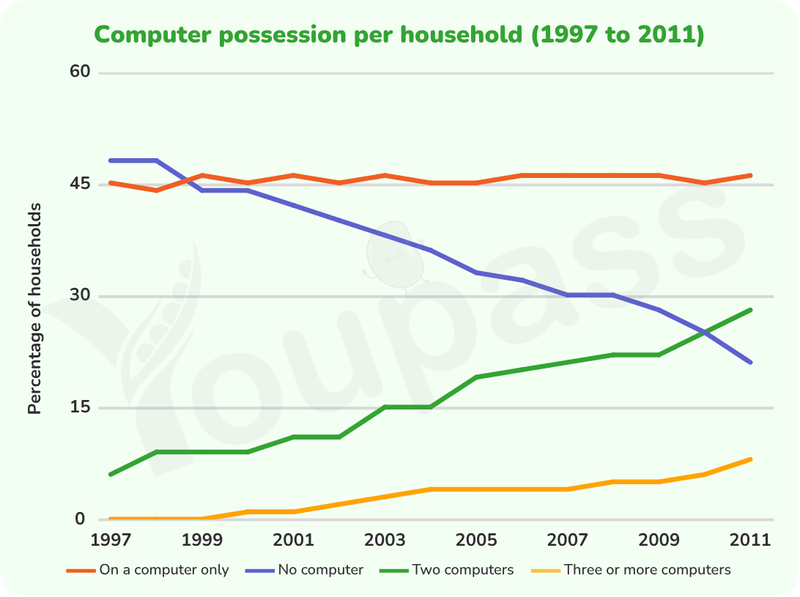
The given line graph illustrates how many computers belonged to houses in specific country in Europe over the period of 14 years, beginning at 1997. In general, it is obvious that the number of household possess two and three or more computers increased throughout the period, whereas the opposite pattern was seen in the figure for houses didn't have any computers. Notably, the quantity of houses had only one computer unchanged and it is the highest number in the graph over the period shown. Looking for the detailed features, the percentage of houses had two electronic devices stood at aroung 10% in the initial year, whereas at that moment, there is no data for the houses possessed three or more computers. Until 2003, the figure for household had more than two computers increased to only around 5%, in terms for the house had 2 computers, this number moderatly climbed up to 15% in the same year. The figures for house possessed two electronic devices continued growed, and eventually end at nearly 30%, which was nearly three times higher than the figure for three or more computers. As for only one computer, in 1997, it started at 45% and after some minor fluctuations, the figure for them was unchanged, making them the highest proportion over the period of 14 years. Despite beginning at the highest point, the number of people didn't possess any electronic applications dramatically fall to approximately 20% in the end of the period. It means that the access of technological advancements in daily lives.
Sample Detail
The graph below gives information about computer possession by household in one European country between 1997 and 2011. Summarise the information by selecting and reporting the main features, and make comparisons where relevant.
20/07/2026 08:51 5.5 points
Topic
The graph below gives information about computer possession by household in one European country between 1997 and 2011. Summarise the information by selecting and reporting the main features, and make comparisons where relevant.
Word count: 256
Chart/Graph
Essay
Overall Scores
5.5±0.5
Basic
Writing Criteria Scores
TA6.0
CC6.0
LR5.0
GRA6.0
Click on any highlighted text in the essay to view detailed suggestions for improvement.
Deep Analysis
Task 1 - Academic Writing
4 tools available
Sample Essay - IELTS Writing Task 1
No sample essay
Click the button below to analyze and generate a high-quality sample essay for Task 1.