
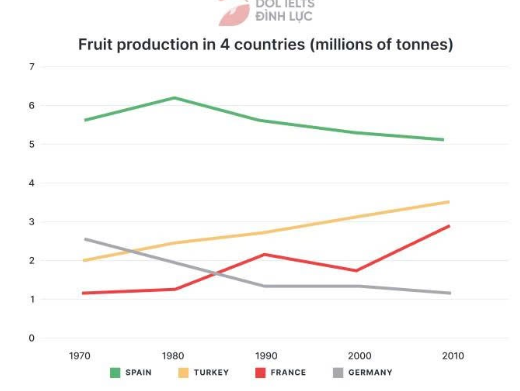
The line chart presents how much fruit produced in France, Spain, Germany and Turkey between 1970 and 2010. Overall, two major trends were seen in the amount of fruit produced in four different countries. In which, the figure for Turkey and France showed an upward trend, while that of Spain and Germany recorded the opposite trajectory. Additionally, Spain dominated the fruit market over a 40-year period. Regarding two countries witnessed the upward trend, starting as the country producing the least fruit which stood at 1.1 in 1970, the data on France saw a slight rise to 1.2 in 1980. In the next 30 years, a fluctuation was recorded in this country, but the amount of fruit of France still increased in general and reached the third position in 2010. Whereas, in the same period, Turkey showed a sustainable increase in the amount of fruit produced from 2 in 1970, surpassed Germany and climbed to 3.5 in 2010, standing at second place. In contrast, starting at 2.6 in 1970, fruit production in Germany dropped significantly by 50% to 1.3 in 1990. In the next 10 years, this country’s data stayed unchanged then decreased slightly to 1.1 in 2010. Additionally, the figure for Spain saw a rise of 0.6 from 1970 to 1980 and recorded a continuous decrease in the next three decades. Although it fell in general at the end of the period, fruit output in Spain still dominated the market over the period and was always noticeably higher than the remaining countries.
नमूना विवरण
The graph shows the amount of fruit produced in four countries (France, Spain, Germany, Turkey) from 1970 to 2010. Summarize the information by reporting the main features, and making comparisons where relevant.
20/07/2026 08:53 7.0 अंक
विषय
The graph shows the amount of fruit produced in four countries (France, Spain, Germany, Turkey) from 1970 to 2010. Summarize the information by reporting the main features, and making comparisons where relevant.
शब्दों की संख्या: 252
चार्ट/ग्राफ
Essay
समग्र स्कोर
7.0±0.5
अच्छा
राइटिंग मानदंड स्कोर
TA7.0
CC7.0
LR7.0
GRA7.0
सुधार के विस्तृत सुझाव देखने के लिए लेख में किसी भी हाइलाइट किए गए टेक्स्ट पर क्लिक करें।
गहन विश्लेषण
Task 1 - Academic Writing
4 उपकरण उपलब्ध
नमूना लेख - IELTS Writing Task 1
कोई नमूना लेख नहीं
Task 1 के लिए उच्च-गुणवत्ता वाला नमूना लेख विश्लेषण और बनाने के लिए नीचे दिए गए बटन पर क्लिक करें।