
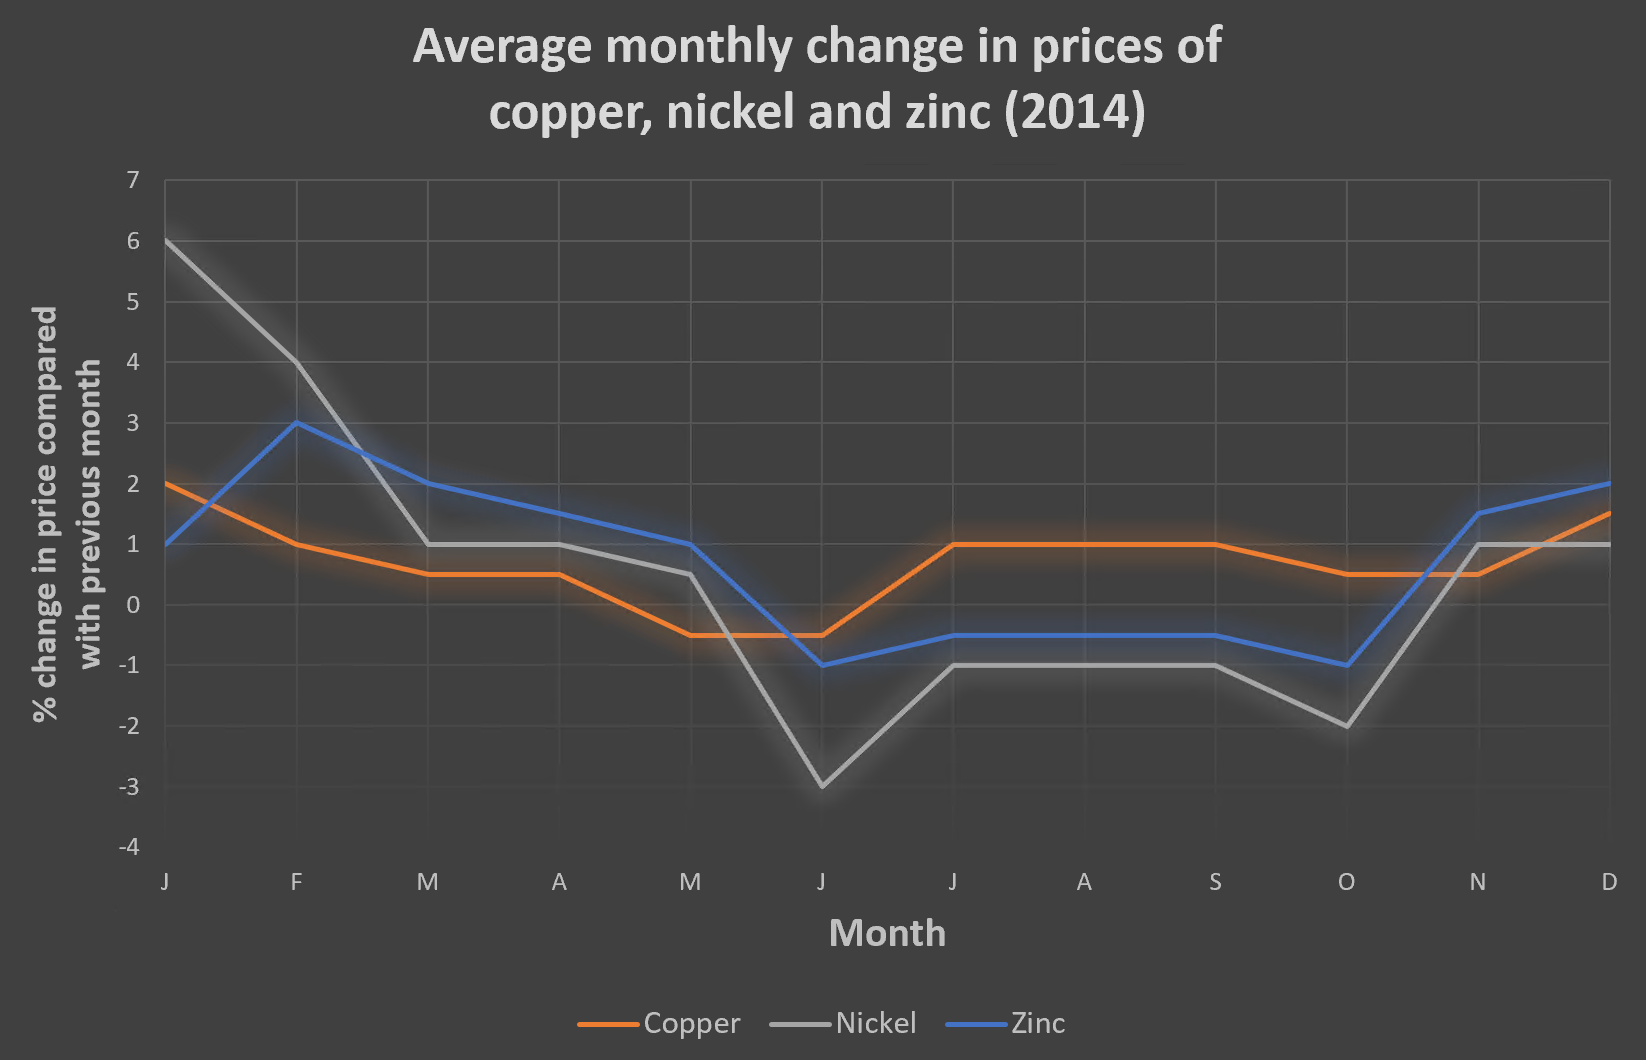
The average changes in the prices of three distinct types of metal, namely copper, nickel and zinc on a monthly basis are illustrated in the provided line graph. Overall, it is evident that the proportion of nickel has the greatest volatility among three types of metals, it was followed by zinc which has a softer fluctuation; whereas the figure for copper was the steadiest. Moreover, the prices of three metals stayed unchanged from July to September. Concerning the percentages of the metal which had the greatest volatility, it started at a high of 6% then dropped gradually before reaching a low of –3% in the middle of the year. Subsequently, it recovered by staying at the same price for three months straight. It then reached to precisely 1% at the end of the period, becoming the metal with the lowest price change. Regarding the figure for the others. Zinc commenced the lowest at 1% then reached its peak at 3% in February before decreasing consistently and recovered at 2%, becoming the metal with the most substantial change. While that of copper only fluctuated from a range of –0.5% to 2%, it dropped slowly initially then surge to 1,5% at the end of the year.
Sample Detail
The graph below shows the average monthly change in the prices of three metals during 2014.
20/07/2026 08:59 7.0 points
Topic
The graph below shows the average monthly change in the prices of three metals during 2014.
Word count: 204
Chart/Graph
Essay
Overall Scores
7.0±0.5
Good
Writing Criteria Scores
TA7.0
CC7.0
LR7.0
GRA7.0
Click on any highlighted text in the essay to view detailed suggestions for improvement.
Deep Analysis
Task 1 - Academic Writing
4 tools available
Sample Essay - IELTS Writing Task 1
No sample essay
Click the button below to analyze and generate a high-quality sample essay for Task 1.