
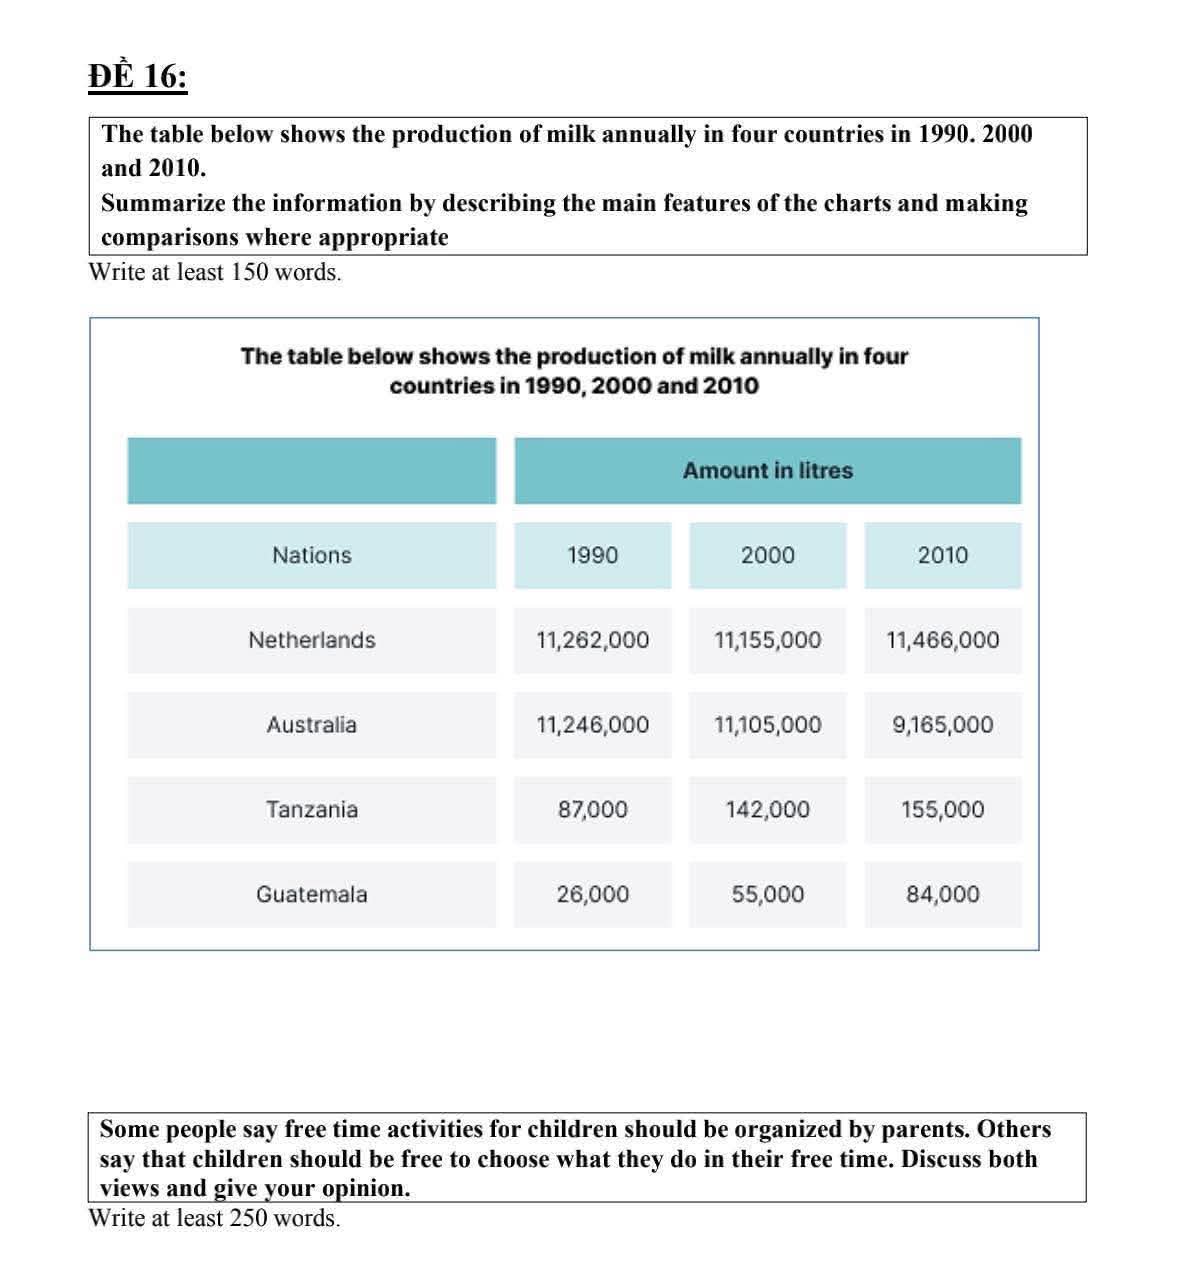
The table illustrates the amount of milk manufatured annually in Netherlands, Australia, Tanzania and Guatemala in three different years. Overall, milk production in Netherlands accounted for the highest percentage; by contrast, the production of milk in Guatemala was lowest in the given period. It is also noticeable that the manufacture of milk in Australia witnessed a downward trend compared to other countries. Between 1990 and 2000 saw a significant decline in milk output in Netherlands by around 107. It then reached a peak of about 11,466,000. By contrast, the amount of milk in Guatemala took up the lowest proportion from around 26.000 to about 84.000 during the while 30-year period. Over the following 20 years, there was a slight drop in milk manufacture in Australia to only 11.105.000. Afterward, this number fell considerably to approximately 9,165,000 in 2010. Throughout the period shown an upward trend in the manufacture of milk in Tanzinia to roughly 155.000.
รายละเอียดตัวอย่าง
Task 1: The table below shows the production of milk annually in four countries in 1990, 2000 and 2010. Summarize the information by describing the main features of the charts and making comparisons where appropriate.
20/07/2026 09:05 5.0 คะแนน
หัวข้อ
Task 1: The table below shows the production of milk annually in four countries in 1990, 2000 and 2010. Summarize the information by describing the main features of the charts and making comparisons where appropriate.
จำนวนคำ: 155
แผนภูมิ/กราฟ
Essay
คะแนนรวม
5.0±0.5
พื้นฐาน
คะแนนเกณฑ์การเขียน
TA5.0
CC6.0
LR5.0
GRA5.0
คลิกข้อความที่ไฮไลต์ในเรียงความเพื่อดูคำแนะนำรายละเอียดเพื่อพัฒนา
การวิเคราะห์เชิงลึก
Task 1 - Academic Writing
4 tools available
บทความตัวอย่าง - IELTS Writing Task 1
ยังไม่มีบทความตัวอย่าง
กดปุ่มด้านล่างเพื่อวิเคราะห์และสร้างบทความตัวอย่างคุณภาพสูงสำหรับ Task 1