
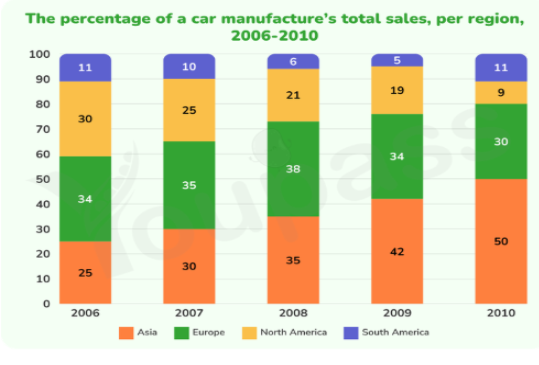
The given bar chart illustrates how the percentage of a car manufacturer’s total revenues in 4 distinct areas changed (namely Asia, Europe, North America, and South America) between 2006 to 2010. Overall, while Asia experienced an increase, the opposing trend was true for Europe and North America. Meanwhile, the total sale in South America remained unchanged despite some fluctuations, Moreover, the figure for sale in Asia rose significantly. The percentage of the total sales of the car manufacturer in Europe was the highest in 2006, accounting for 34%. Then, this figure increased significantly to 38% in 2008, prior to a decline of 8% to 30%, securing the second place. Similarly, the percentage of sales in North America followed the same trend, but to a greater extent, which stood at 30% in 2006. By 2010, the figure for sales in North America bottomed out at 9%, marking a decrease of 21 percentage points. Returning to the remaining categories, around 25% of total sales came from Asia in 2006, ranking third among surveyed regions. However, the situation changed as by 2009, when the proportion of sales in Asia went up suddenly to 42%, overtaking the first place of Europe’s sales. In 2010, the figure for Asia peaked at 50%. Conversely, only 11% of total sales stemmed from South America in 2006, despite some fluctuations throughout the timeline, this figure remained unchanged in 2010.
Sample Detail
The chart below shows the percentage of a car manufacturer’s total sales in various regions from 2006 to 2010. Summarise the information by selecting and reporting the main features, and make comparisons where relevant.
20/07/2026 09:18 7.0 points
Topic
The chart below shows the percentage of a car manufacturer’s total sales in various regions from 2006 to 2010. Summarise the information by selecting and reporting the main features, and make comparisons where relevant.
Word count: 231
Chart/Graph
Essay
Overall Scores
7.0±0.5
Good
Writing Criteria Scores
TA7.0
CC7.0
LR8.0
GRA7.0
Click on any highlighted text in the essay to view detailed suggestions for improvement.
Deep Analysis
Task 1 - Academic Writing
4 tools available
Sample Essay - IELTS Writing Task 1
No sample essay
Click the button below to analyze and generate a high-quality sample essay for Task 1.