
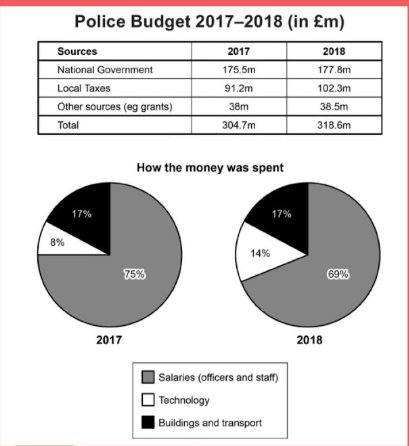
The table and pie chart given illustrates the police budget from 2017 to 2018 measured in millions of Euros in a Britain area. While the table graph demonstrates the origin of the money, the pie chart depicts the proportion of its distribution. Overall, sponsors invested more money over the period, with National Government topped the list. Meanwhile, most of the money was used to pay for the polliceman, but this had decreased in the next year, resulting in an increase in Technology, while buildings and transports remained unchanged. Looking firstly at the police budget, its investment witnessed a small increase of all the categories. Investment fund of National Government accounted for more than half of the total, with 177.8m Euros in 2018, just 0,3m higher than that in 2017. Despite holding a more impressive increase from 91,2m to 102,3m Euros, far outripping other sources around 38m Euros, Local taxes remained the second largest sponsors over the period. After all, 318,6m Euros was invested in 2018, roughly 14m higher than that in the previous year. As for the distribution, the policeman was initally offered with a huge sum, three-quarter of the total . However, in the next year, the remaining salary only made up for 69% due to an 6-percent increase to 14% of Technology, showing the government concern for economics development. Meanwhile, the amount for buildings and transports stayed the same over time.
নমুনা বিস্তারিত
The table and charts below give information on the police budget for 2017 and 2018 in one area of Britain. The table shows where the money came from and the charts show how it was distributed. Summarise the information by selecting and reporting the main features, and make comparisons where relevant.
20/07/2026 09:34 6.0 স্কোর
টপিক বা বিষয়
The table and charts below give information on the police budget for 2017 and 2018 in one area of Britain. The table shows where the money came from and the charts show how it was distributed. Summarise the information by selecting and reporting the main features, and make comparisons where relevant.
শব্দ সংখ্যা: 233
চার্ট/গ্রাফ
Essay
সামগ্রিক স্কোর
6.0±0.5
মোটামুটি
রাইটিং মানদণ্ড স্কোর
TA6.0
CC7.0
LR6.0
GRA6.0
উন্নতির জন্য বিস্তারিত পরামর্শ দেখতে প্রবন্ধের হাইলাইট করা যেকোনো লেখায় ক্লিক করুন।
গভীর বিশ্লেষণ
Task 1 - Academic Writing
4 tools available
নমুনা রচনা - IELTS Writing Task 1
কোনো নমুনা রচনা নেই
টাস্ক ১-এর জন্য উচ্চমানের নমুনা রচনা বিশ্লেষণ এবং তৈরি করতে নিচের বাটনে ক্লিক করুন।