
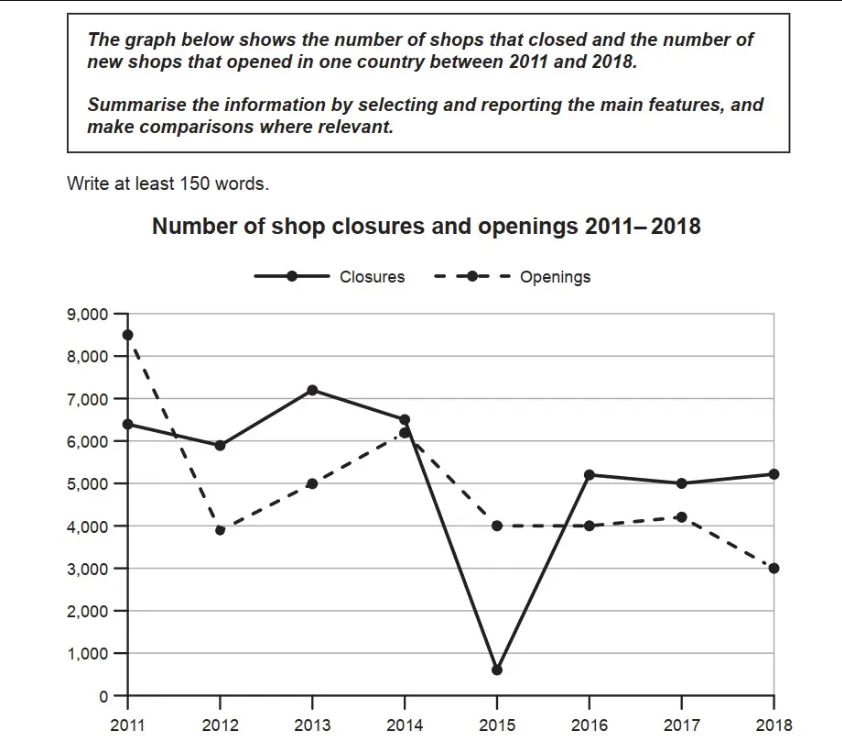
The line chart illustrates the number of shop closures and openings in a country from 2011 to 2018. Overall, in 2011, the number of new shops was higher, while in 2018, it was lower than the number of closures. Besides, the figures for both closing and new opening shops decreased steeply after seven years. Starting with the highest point in the first recorded year, the quantity of openings stood at 8,500 stores. The figure then dropped noticeably by nearly 4,000 in 2012, before rising gradually to around 6,100 over the next two years. The number of new shops declined again over the next four years, reaching its lowest point in 2018 at 3,000 shops. Starting with approximately 6,200 shops in 2011, the figure of shops that closed grew moderately and peaked at 7,100 in 2013. Over the next two years, it fell dramatically, hitting the lowest point of 500 closures in 2015 before remaining stable at around 5,000 closing shops in the period between 2016 and 2018.
Detail Sampel
The graph below shows the number of shops that closed and the number of new shops that opened in one country between 2011 and 2018. Summarise the information by selecting and reporting the main features, and make comparisons where relevant
20/07/2026 09:43 7.0 skor
Topik
The graph below shows the number of shops that closed and the number of new shops that opened in one country between 2011 and 2018. Summarise the information by selecting and reporting the main features, and make comparisons where relevant
Jumlah kata: 167
Grafik/Diagram
Essay
Skor Keseluruhan
7.0±0.5
Baik
Skor Kriteria Writing
TA7.0
CC7.0
LR7.0
GRA7.0
Klik teks yang ditandai di esai untuk melihat saran detail untuk peningkatan.
Analisis mendalam
Task 1 - Academic Writing
4 tools available
Esai contoh - IELTS Writing Task 1
Belum ada esai contoh
Silakan klik tombol di bawah untuk menganalisis dan membuat esai contoh berkualitas tinggi untuk Task 1.