
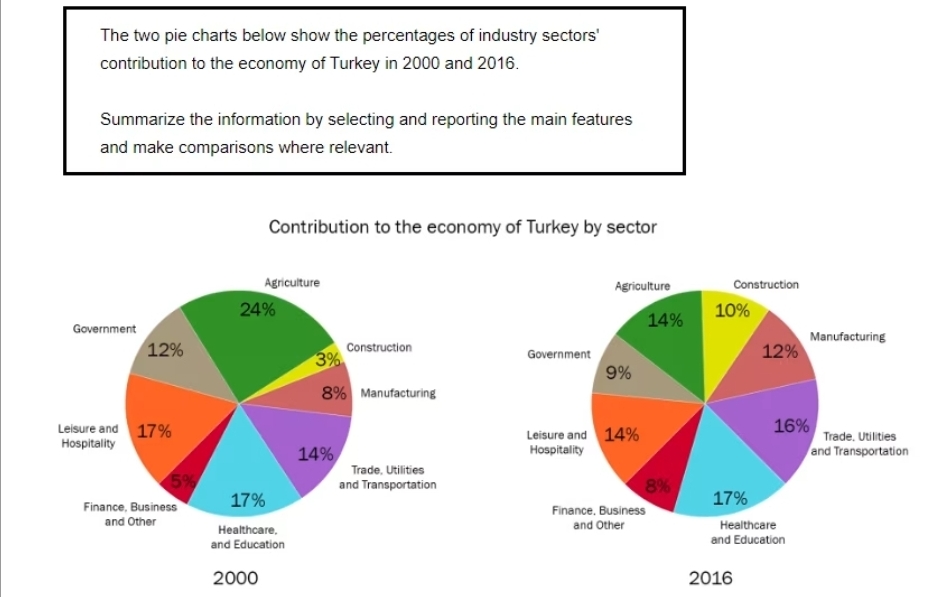
The two pie charts present the proportion of the industry sector’s contribution to the economy of Turkey between 2000 and 2016. Overall, Agriculture was the highest figure in 2000, but it decreased considerably by the end of the period. By contrast, the contribution of sectors such as Finance, Business and Other, Trade, Utilities and Transportation, Manufacturing, Construction increased, while that of Healthcare and Education stayed the same. In 2000, the contribution proportion of Construction; Manufacturing; Trade, Utilities and Transportation; Finance, Business and Other were relatively low, especially, for that of Construction and Finance, Business and Other with only 3% and 5%, respectively. Additionally, the contribution percentages of Manufacturing accounted for 8%, while Trade, Utilities and Transportation was the highest with 14%. However, after the period of 6 years, all contributions of those sectors were increased slightly. The rising percentages in those contribution proportions followed a linear order, with 2%, 3%, 4% and 7% increased in the contribution percentages of Trade, Utilities and Transportation; Finance, Business and Other; Manufacturing and Construction, respectively. On the other hand, the contribution of sectors such as Agriculture, Government, Leisure and Hospitality winessed considerbly decreased in the end, while that of Healthcare and Education recorded a similar figure throughout the period. Specifically, in the beginning, the contribution proportion of Agricultural dominated the pie chart of the 2000 period with 24%, whilst that of Government accounted for 12%, while the rest contribution percentages of this categories had the same figures of 17%. In 2016, the contribution proportion of Agriculture fell remarkbly with 10% decreased, made it became balanced out with that of Leisure and Hospitality, which was 14% after a 3% dropped. Moreover, the contribution proportion of Government witnessed a 3% decreased, from 12% to 9%. While that of Healthcare and Education stayed at 17%, but eventually surpassed Agriculture’s contribution percentages in the beginning and became the highest figure by the end of the period.
Detail Sampel
The two pie charts below show the percentages of industry sectors' contribution to the economy of Turkey in 2000 and 2016.
20/07/2026 09:42 6.5 skor
Topik
The two pie charts below show the percentages of industry sectors' contribution to the economy of Turkey in 2000 and 2016.
Jumlah kata: 318
Grafik/Diagram
Essay
Skor Keseluruhan
6.5±0.5
Cukup
Skor Kriteria Writing
TA7.0
CC7.0
LR6.0
GRA6.0
Klik teks yang ditandai di esai untuk melihat saran detail untuk peningkatan.
Analisis mendalam
Task 1 - Academic Writing
4 tools available
Esai contoh - IELTS Writing Task 1
Belum ada esai contoh
Silakan klik tombol di bawah untuk menganalisis dan membuat esai contoh berkualitas tinggi untuk Task 1.