
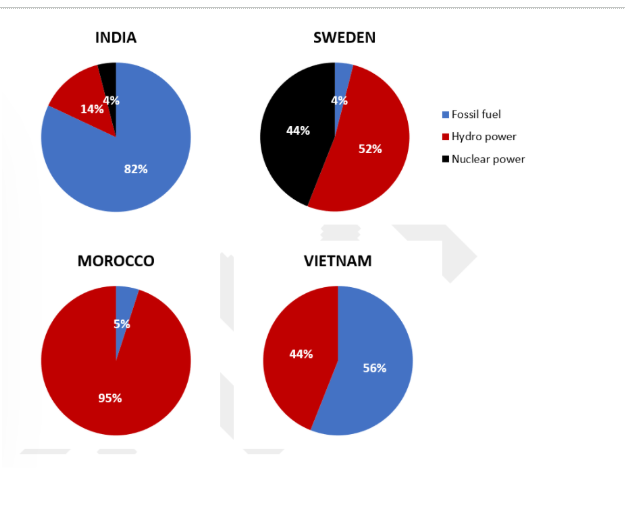
The given pie charts depict the electric supplies which are manufactured in 4 different nations namely: India, Sweden, Morocco, Vietnam in two separate years 2003 and 2008. Overall, it is clear that while India and Sweden produced nuclear power, Morocco and Vietnam didn’t. Moreover, the largest proportion of produced electricity supplies in India and Vietnam belonged to fossil fuel, whereas those figures in Sweden and Morocco was hydro power. To begin with, in Vietnam, the percentage of fossil fuel stood at 56% of the total percentage of energy supplies, while the figure for Morocco was only 5%. The rest of the electricity was 44% and 95% in both countries, respectively. In India however, accounted for the largest proportion of fossil fuel among four countries, which recorded 82% of the entire quantity of electricity produced. Those figures in Sweden only amounted to 4%, which is a minimal proportion of the total. In addition, the percentage of hydro power which was consumed for electricity production in Sweden made up more than a half of the aggregate, followed by 14% in India. The remaining statistics in both countries was nuclear power.
Sample Detail
2) The charts show the sources of electricity produced in 4 countries between 2003 and 2008.Summarise the information by selecting and reporting the main features, and make comparisons where relevant.
20/07/2026 09:51 6.5 points
Topic
2) The charts show the sources of electricity produced in 4 countries between 2003 and 2008.Summarise the information by selecting and reporting the main features, and make comparisons where relevant.
Word count: 188
Chart/Graph
Essay
Overall Scores
6.5±0.5
Fair
Writing Criteria Scores
TA7.0
CC7.0
LR6.0
GRA6.0
Click on any highlighted text in the essay to view detailed suggestions for improvement.
Deep Analysis
Task 1 - Academic Writing
4 tools available
Sample Essay - IELTS Writing Task 1
No sample essay
Click the button below to analyze and generate a high-quality sample essay for Task 1.