
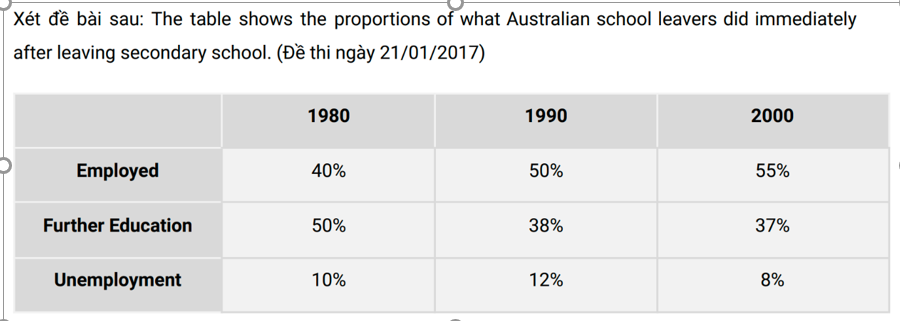
The table shows the percentage of what secondary-school graduates in Australia did right after they graduated from secondary school between 1980 and 2000. Overall, the proportion of secondary-school graduates who immediately got a job considerably increased from 1980 to 2000, recording the highest percentage throughout the given time. Meanwhile, the opposite was true for further education and unemployment. There were 40% of secondary-school graduates in Australia who got a job in 1980, before considerably going up to 50% in 1990 and 55% in 2000, surpassing all other categories. On the other hand, further education experienced a significant decline from 50% in 1980 to 38% in 1990 and nearly unchanged to 37% in 2000. While, 10% was the proportion of secondary-school finished school in Australia who were unemployed in 1980, which fluctuated to 12% in 1990 before it dropped down to 8% in 2000, remained the lowest percentage throughout all given years and all categories.
नमूना विवरण
The table shows the proportions of what Australian school leavers did immediately after leaving secondary school. (Đề thi ngày 21/01/2017)
20/07/2026 10:05 6.5 अंक
विषय
The table shows the proportions of what Australian school leavers did immediately after leaving secondary school. (Đề thi ngày 21/01/2017)
शब्दों की संख्या: 154
चार्ट/ग्राफ
Essay
समग्र स्कोर
6.5±0.5
ठीक
राइटिंग मानदंड स्कोर
TA7.0
CC7.0
LR6.0
GRA6.0
सुधार के विस्तृत सुझाव देखने के लिए लेख में किसी भी हाइलाइट किए गए टेक्स्ट पर क्लिक करें।
गहन विश्लेषण
Task 1 - Academic Writing
4 उपकरण उपलब्ध
नमूना लेख - IELTS Writing Task 1
कोई नमूना लेख नहीं
Task 1 के लिए उच्च-गुणवत्ता वाला नमूना लेख विश्लेषण और बनाने के लिए नीचे दिए गए बटन पर क्लिक करें।