
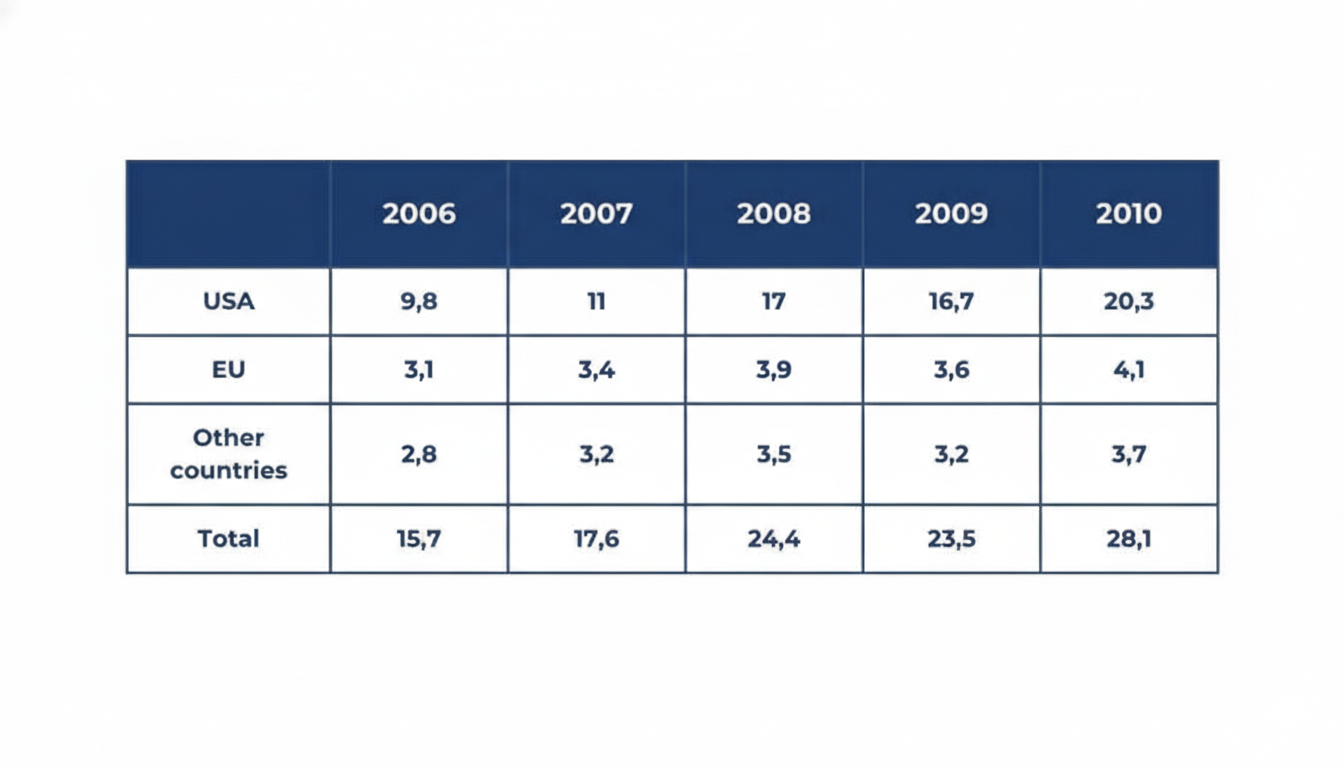
The table illustrates the spending on the development of countries, measured in millions of dollars, spent by the USA, the EU countries and other countries between 2006 and 2010. Overall, spending generally increased over the period, with the exception of 2009 when all categories experienced a modest decline before recovering in the final year. The USA consistently spent far more than the EU and other countries. In 2006, the total amount of money stood at 15.7 million dollars, of which the USA contributed 9.8 million dollars. The EU spent 3.1 million dollars compared with 2.8 million dollars contributed by other countries. By 2007, the total spending experienced a gradual increase to 17.6 million dollors, while spending by the USA increased to 11 million dollars. The expenditure by the EU and other countries recorded 3.4 and 3.2 million dollars, respectively. The upward trend continued in 2008, when total spending reached 24.4 million dollars, including 17 million spent by the USA, 3.9 million from the EU and 3.5 million from other countries In 2009, all figures decreased slightly. The total amount declined slightly to 23.5 million dollars while spending by the USA decreased to 16.7 million dollars. Similarly, expenditure by the EU countries and other countries also experienced a slight decrease to 3.6 and 3.2 million dollars, respectively. In the final year, there was a recovery. The total spending increased dramatically to 28.1 with 20.3 million dollars from the USA. The EU spent 4.1 million dollars, whereas the other countries allocated 3.7 million dollars.
নমুনা বিস্তারিত
The table shows the amount of money given to developing countries by the USA, EU countries and other countries from 2006 to 2010 (Figures are in millions of dollars). Summarize the information be selecting and reporting the main features and make comparisons where relevant.
20/07/2026 10:05 7.5 স্কোর
টপিক বা বিষয়
The table shows the amount of money given to developing countries by the USA, EU countries and other countries from 2006 to 2010 (Figures are in millions of dollars). Summarize the information be selecting and reporting the main features and make comparisons where relevant.
শব্দ সংখ্যা: 252
চার্ট/গ্রাফ
Essay
সামগ্রিক স্কোর
7.5±0.5
ভালো
রাইটিং মানদণ্ড স্কোর
TA8.0
CC8.0
LR7.0
GRA7.0
উন্নতির জন্য বিস্তারিত পরামর্শ দেখতে প্রবন্ধের হাইলাইট করা যেকোনো লেখায় ক্লিক করুন।
গভীর বিশ্লেষণ
Task 1 - Academic Writing
4 tools available
নমুনা রচনা - IELTS Writing Task 1
কোনো নমুনা রচনা নেই
টাস্ক ১-এর জন্য উচ্চমানের নমুনা রচনা বিশ্লেষণ এবং তৈরি করতে নিচের বাটনে ক্লিক করুন।