
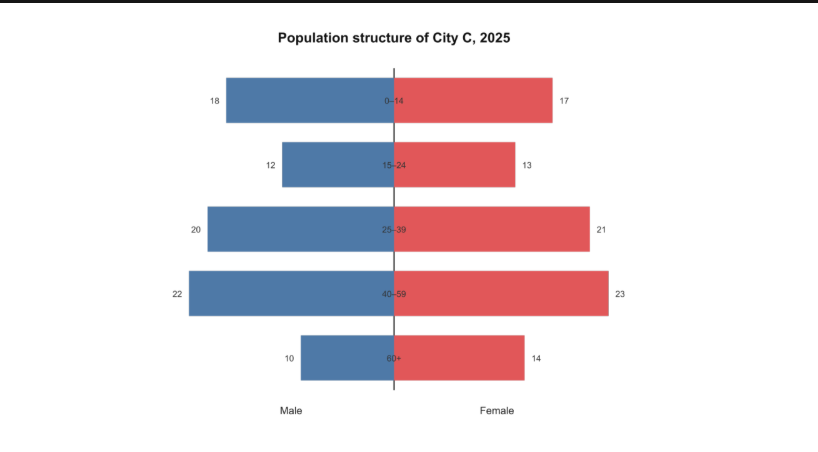
The chart illustrates how population of city C is represented and managed according to age and gender in 2025. Overall, the population was concentrated mainly in the 25-59 age group. The females made up a slightly larger share than males in most adult age groups, especially those who aged 60 and over. In 2025, the number of the youngest group was the only record with more boys than girls. It was also the third largest population of the chart, which showed 18 boys and 17 girls. People aged from 15 to 59 years old was divided into three age groups with a same gap in gender. Remarkably, the 40-59 group dominated the population, with 23 females and 22 males at that year. This was followed by the figures for 25-39 group and 15-24 group. The difference between young adults and adults was not significant, with just two more people in both genders of the greatest proportion compared to the second-popular one. The over 60 age groups was the smallest share and experienced a less balanced number, with 14 females and 10 males.
รายละเอียดตัวอย่าง
The chart shows the population structure of City C by age and gender in 2025.
20/07/2026 10:06 7.0 คะแนน
หัวข้อ
The chart shows the population structure of City C by age and gender in 2025.
จำนวนคำ: 182
แผนภูมิ/กราฟ
Essay
คะแนนรวม
7.0±0.5
ดีมาก
คะแนนเกณฑ์การเขียน
TA7.0
CC7.0
LR7.0
GRA7.0
คลิกข้อความที่ไฮไลต์ในเรียงความเพื่อดูคำแนะนำรายละเอียดเพื่อพัฒนา
การวิเคราะห์เชิงลึก
Task 1 - Academic Writing
4 tools available
บทความตัวอย่าง - IELTS Writing Task 1
ยังไม่มีบทความตัวอย่าง
กดปุ่มด้านล่างเพื่อวิเคราะห์และสร้างบทความตัวอย่างคุณภาพสูงสำหรับ Task 1