
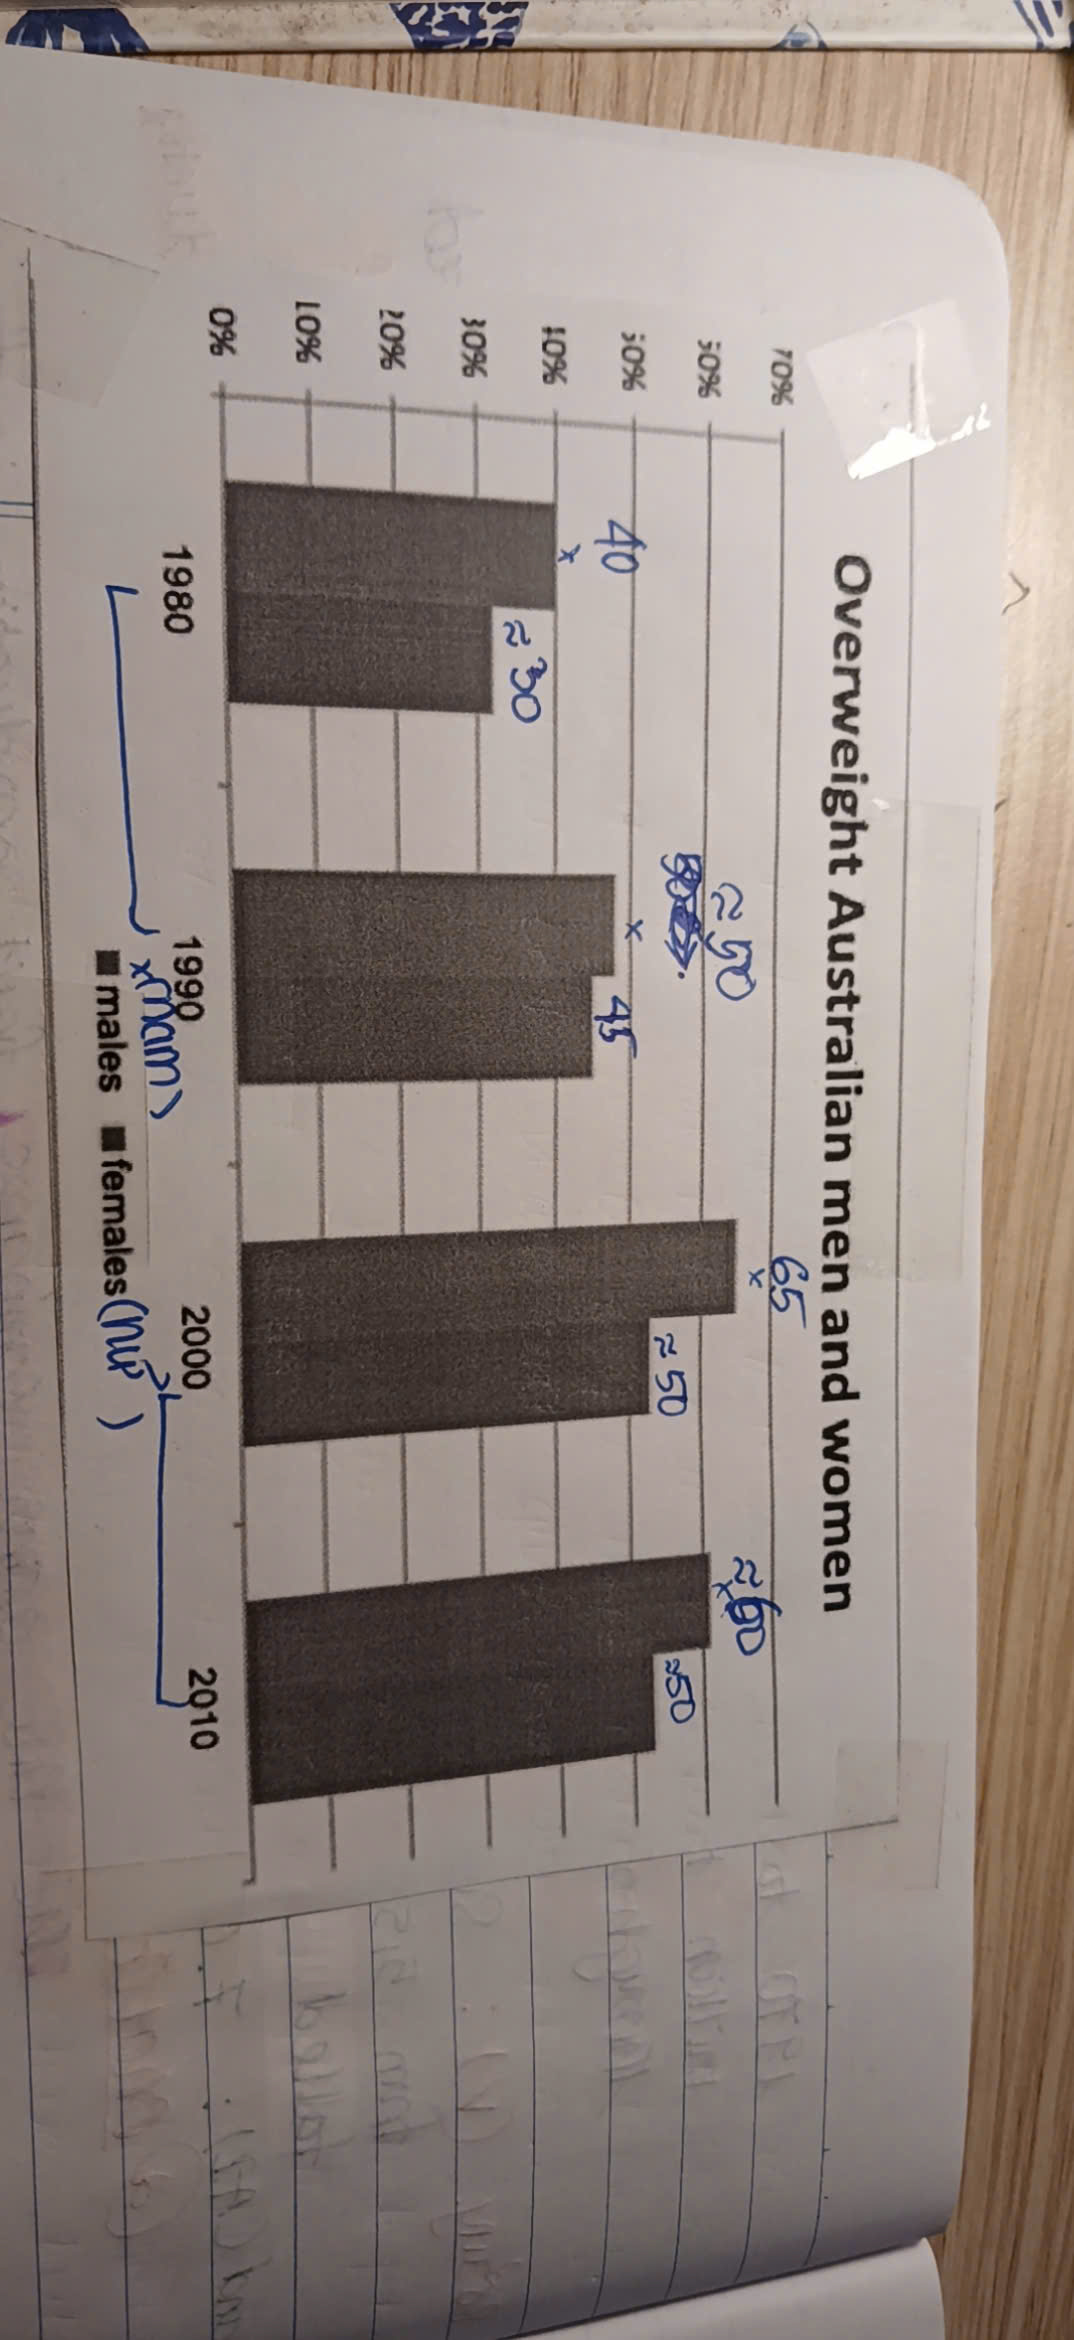
The bar chart illustrates the percentage of overweight Australian men and women between 1980 and 2010. In general, the percentage of overweight Australian men in 2000 was highest throughout the period. In contrast , the proportion of overweight Australian women recored the highest figure in 2000 and 2010, but remained lower than males's figure. From 1980 to 1990, both figures were the lowest during the 30-years period. In 1980, the percentage of overweight males stood at 40%. Over the following decade, this figure had risen to 50%. Meanwhile, the figure for females also increased, from 30% to 45%. Despite this growth, the percentage for men was higher than that for women. Turning to the period from 2000 to 2010, the percentage of overweight men climbed from 50% in 1990 to a peak of 65% in 2000 before declining to 60% in 2010. While the propotion for men declined from 65% to 60%, the percentage for women remained stable at 50%. Despite the decline, the figure for men remained consistently higher than that for women throughout the period
नमूना विवरण
The bar chart gives information about overweight Australian men and women
20/07/2026 10:19 5.5 अंक
विषय
The bar chart gives information about overweight Australian men and women
शब्दों की संख्या: 177
चार्ट/ग्राफ
Essay
समग्र स्कोर
5.5±0.5
बुनियादी
राइटिंग मानदंड स्कोर
TA5.0
CC6.0
LR5.0
GRA6.0
सुधार के विस्तृत सुझाव देखने के लिए लेख में किसी भी हाइलाइट किए गए टेक्स्ट पर क्लिक करें।
गहन विश्लेषण
Task 1 - Academic Writing
4 उपकरण उपलब्ध
नमूना लेख - IELTS Writing Task 1
कोई नमूना लेख नहीं
Task 1 के लिए उच्च-गुणवत्ता वाला नमूना लेख विश्लेषण और बनाने के लिए नीचे दिए गए बटन पर क्लिक करें।