
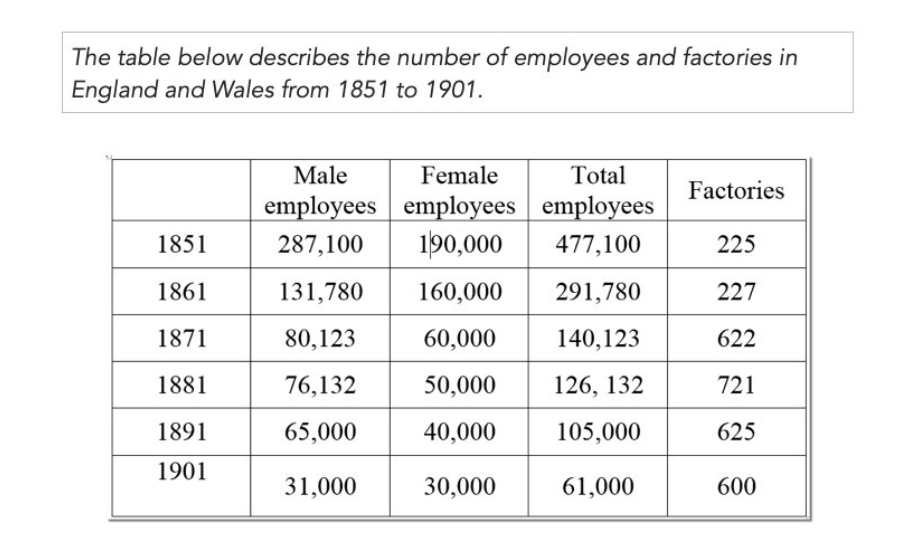
The table presents the number of workers and factories in England and Wales between over a 50-year period, starting in 1851. Overall, the number of total employees witnessed a downward trend throughout the period while the opposite was true for factories. In terms of the number of Male and Female employees, both of these recorded the same pattern, which was decreasing. However, the initial numbers of Male workers were more significant than that of Female ones. Starting in 1851, the number of total employees was 477.100 with 287.100 Male and 190.000 Female workers, while that of Factories was 225, which was the lowest number of this figure. After a decade, the number of total employees began to decrease to 291.780, resulting in a drop in the number of Male and Female employees. While the number of Male workers fell remarkably to 131.780, that of Female workers witnessed a 30.000 decrease. The number of factories, in contrast, increased slightly from 225 to 227 in 1861. The pattern was the same until 1881, when the number of plants peaked at 721 before dropping significantly by the end of the period. While that of the total employees still witnessed a downward trend and hit the bottom in 1901 at 61.000, caused by the relatively similar figures of the number of Male and Female employees.
Sample Detail
The table below describes the number of employees and factories in England and Wales from 1851 to 1901.
20/07/2026 10:20 6.5 points
Topic
The table below describes the number of employees and factories in England and Wales from 1851 to 1901.
Word count: 221
Chart/Graph
Essay
Overall Scores
6.5±0.5
Fair
Writing Criteria Scores
TA7.0
CC7.0
LR6.0
GRA6.0
Click on any highlighted text in the essay to view detailed suggestions for improvement.
Deep Analysis
Task 1 - Academic Writing
4 tools available
Sample Essay - IELTS Writing Task 1
No sample essay
Click the button below to analyze and generate a high-quality sample essay for Task 1.