
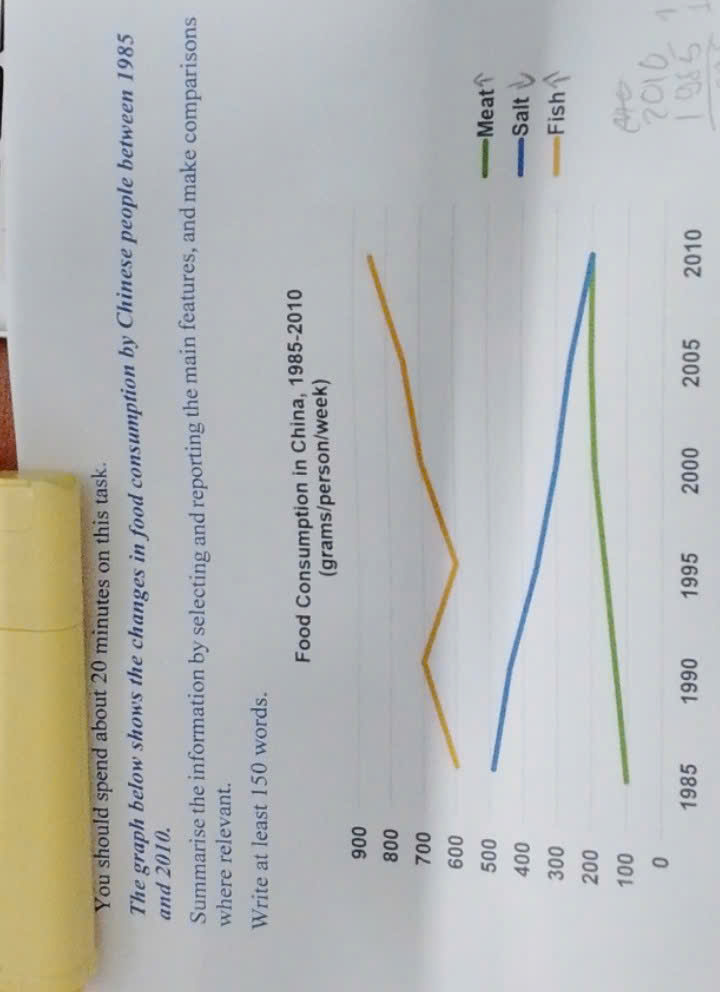
Given is the graph illustrates significant changes in food intake by Chinese people, over a 25-year period, from 1985 to 2010. Overall, it is evident that the consumption of both fish and meat experienced a gradual increase. In particularly, fish intake accounted for the highest their ingestion. However, eating salt followed fall sustainably. According to the graph, the intakes of fish and meat underwent a noticeable rise. Between 1985 and 2010, fish showed grow, began 600 grams per week, then climbing at 700 grams in 1990 and returning at 600 grams, after increasing at 700 grams in 2000. Before reaching approximately at 900 in 2010. Furthermore, meat consumption followed a double from 100 grams in 1985 to 200 grams in 2000 and remained stable this figure by the end of the period. In contrast, salt intake experienced a slight decrease from 500 grams in 1985 to 200 grams in 2010, which same the share of meat in 2010.
Detail Sampel
the graph below shows the changes in food consumption by Chinese people between 1985 and 2010
20/07/2026 10:45 5.0 skor
Topik
the graph below shows the changes in food consumption by Chinese people between 1985 and 2010
Jumlah kata: 158
Grafik/Diagram
Essay
Skor Keseluruhan
5.0±0.5
Dasar
Skor Kriteria Writing
TA5.0
CC5.0
LR5.0
GRA5.0
Klik teks yang ditandai di esai untuk melihat saran detail untuk peningkatan.
Analisis mendalam
Task 1 - Academic Writing
4 tools available
Esai contoh - IELTS Writing Task 1
Belum ada esai contoh
Silakan klik tombol di bawah untuk menganalisis dan membuat esai contoh berkualitas tinggi untuk Task 1.