
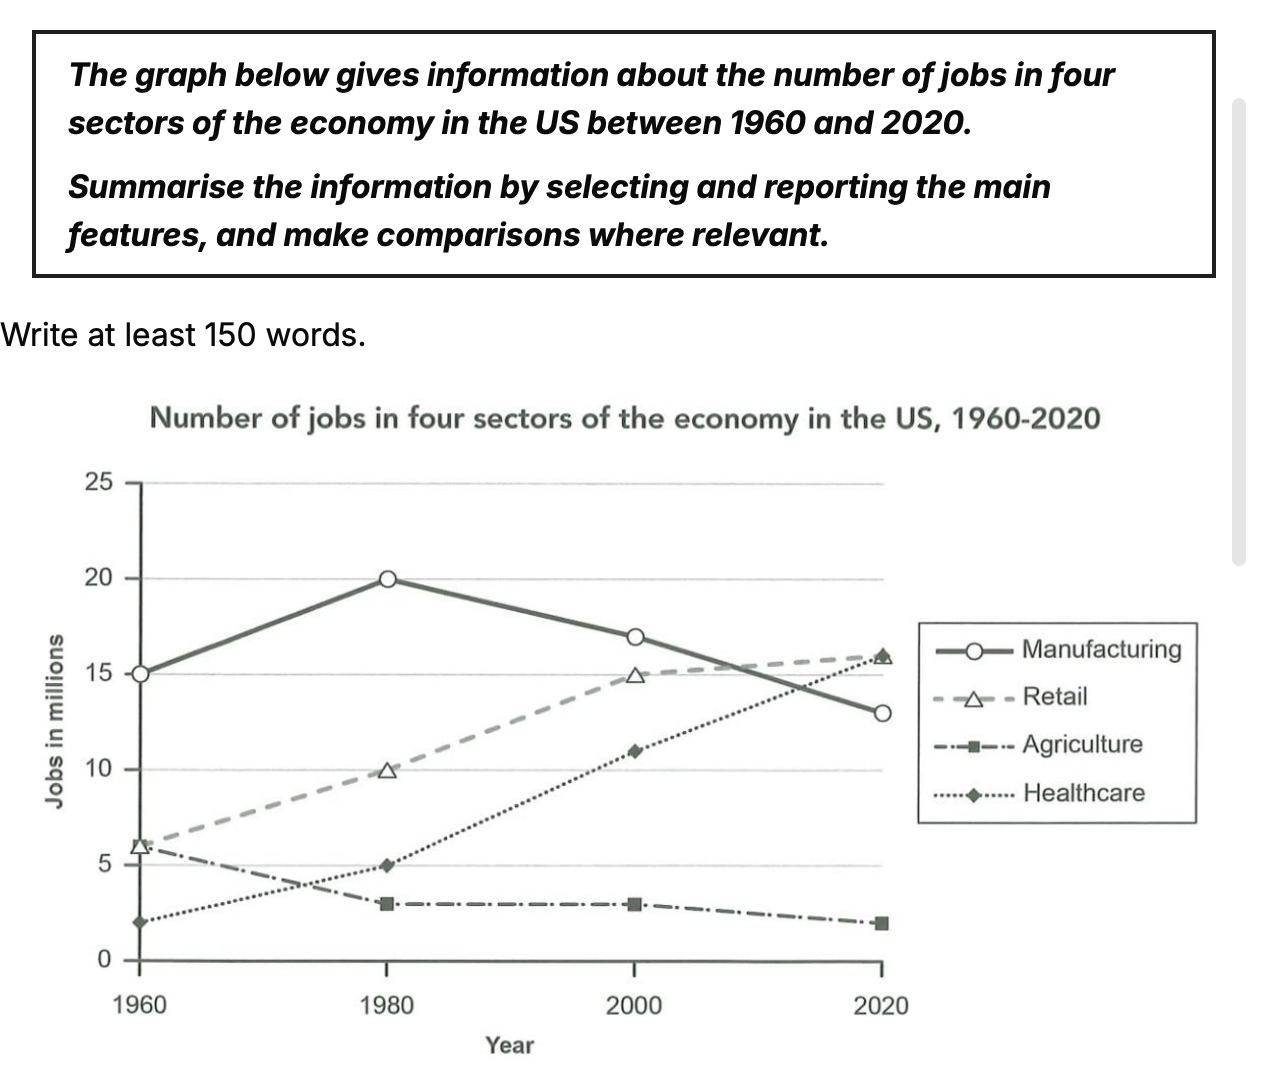
The line graph compares the number of jobs that existed in four industries in the American economy from 1960 to 2020. Overall, it can be seen that while the figure for Manufacturing and Agriculture decreased over time, the opposite was true for Healthcare and Retail. Additionally, employment in Manufacturing was the largest point in the majority of the period, before ceding its dominance to Retail and Healthcare. Regarding the decreasing categories, jobs in Manufacturing were the highest numbers initially, standing at precisely 15 million, which was three times as many as Agriculture. Over the following twenty years, they showed an opposite trend while Manufacturing reached a peak of 20 million, Agriculture experienced a slight decline to roughly 2,5 million. Jobs in Manufacturing plunged to under 15 million at the end of the period, those in Agriculture leveled off in 2000, falling slowly to 2 million in the final year. In contrast, the number of jobs in Healthcare and Retail expanded their job market over time. At the start, Retail was at the same level with Agriculture, standing at about 6 million. Healthcare was the smaller job provider of the two, standing at roughly 2 million. Over the following forty years, both of those increased significantly by approximately 9 million, matching to over 15 million at the end, overtook Manufacturing to become the leading job providers.
รายละเอียดตัวอย่าง
the graph below gives information about the number of jobs in four sectors in the US economy between 1960 and 2020
20/07/2026 10:47 7.0 คะแนน
หัวข้อ
the graph below gives information about the number of jobs in four sectors in the US economy between 1960 and 2020
จำนวนคำ: 225
แผนภูมิ/กราฟ
Essay
คะแนนรวม
7.0±0.5
ดีมาก
คะแนนเกณฑ์การเขียน
TA7.0
CC7.0
LR7.0
GRA7.0
คลิกข้อความที่ไฮไลต์ในเรียงความเพื่อดูคำแนะนำรายละเอียดเพื่อพัฒนา
การวิเคราะห์เชิงลึก
Task 1 - Academic Writing
4 tools available
บทความตัวอย่าง - IELTS Writing Task 1
ยังไม่มีบทความตัวอย่าง
กดปุ่มด้านล่างเพื่อวิเคราะห์และสร้างบทความตัวอย่างคุณภาพสูงสำหรับ Task 1