
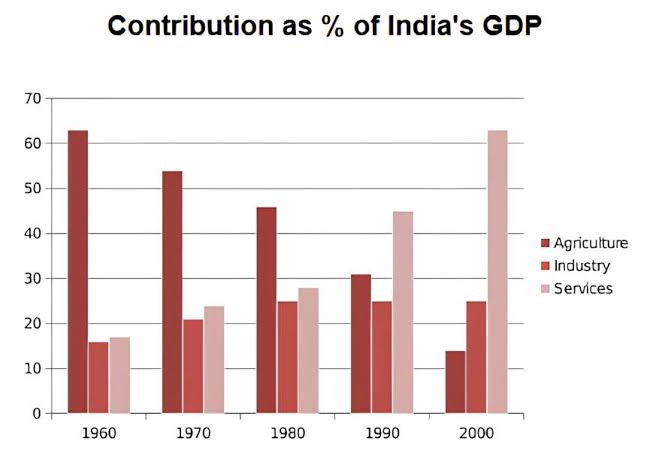
The bar chart compares the percentage of India’s GDP generated by three different sectors namely Agriculture, Industry and Services between 1960 and 2000. What stands out from the graph is the upward trend in the contribution of total GDP in all sectors except for Agriculture. Notably, the proportions of Agriculture and Services underwent big changes, making them swap their positions throughout the period. In 1960, Agriculture accounted for over 62%, followed by Services and Industry, at around 15% and 17%, respectively. Over the next two decades, the contribution of Industry and Services followed the rising pattern with the former going up slightly to nearly 25% and the latter increasing minimally to under 30% while the opposite was true for Agriculture. After experiencing a consistent decrease by 17% from 1960 to 1980, Agriculture portion has successfully narrowed the gap between three of them. During the final 4 decades, the disparity between three sectors widened increasingly by the sharp growth of Service’s contribution and the dramatic decrease of Agriculture portion. The Industry’s contribution remained relatively constant, at approximately 25% while proportion of both Services and Agriculture underwent intensive changes. The Agriculture shares went down consistently to nearly 25% before bottoming out at 13% whereas the figure for Services witnessed a remarkable rise, from under 30% to over 60%, making it the dominant contributor at the end of the period.
নমুনা বিস্তারিত
The bar chart below shows the sector contributions to India’s gross domestic product from 1960 to 2000. Summarise the information by selecting and reporting the main features, and make comparisons where relevant.
20/07/2026 11:01 7.0 স্কোর
টপিক বা বিষয়
The bar chart below shows the sector contributions to India’s gross domestic product from 1960 to 2000. Summarise the information by selecting and reporting the main features, and make comparisons where relevant.
শব্দ সংখ্যা: 227
চার্ট/গ্রাফ
Essay
সামগ্রিক স্কোর
7.0±0.5
ভালো
রাইটিং মানদণ্ড স্কোর
TA7.0
CC7.0
LR7.0
GRA7.0
উন্নতির জন্য বিস্তারিত পরামর্শ দেখতে প্রবন্ধের হাইলাইট করা যেকোনো লেখায় ক্লিক করুন।
গভীর বিশ্লেষণ
Task 1 - Academic Writing
4 tools available
নমুনা রচনা - IELTS Writing Task 1
কোনো নমুনা রচনা নেই
টাস্ক ১-এর জন্য উচ্চমানের নমুনা রচনা বিশ্লেষণ এবং তৈরি করতে নিচের বাটনে ক্লিক করুন।