
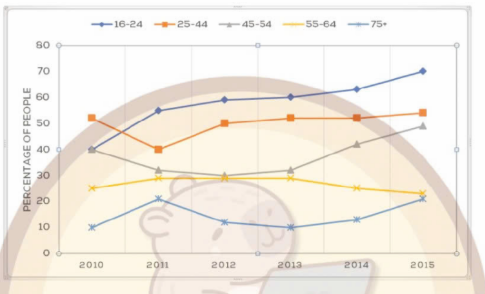
The line chart compares the proportion of people in five different age groups in one city participating in music concerts from 2010 to 2015. Overall, it is clear that all four categories growth, with the figure for 16-24 age group rising substantially, except for 55-64 age group. Additionally, the percentage of people aged 16 to 24 was the lowest throughout the period. The figure for 25-44 age started at just over 51%, it experienced a fluctuation around 50% over 3 first years. This was followed by a gradually increase to just over 52% at the end of period. Similarly, the figure for 16-24 age stood at about 40%, it then surpassed the figure for 25-44 age to become the most prevalent age group attending music concerts over the remaining periods. Turning to the remaining categories, 45-54 age group began in nearly 40%, it then decreased moderately to about 32% in 2012. After that, it grow slightly to just over 33% in 2013 before continuing to rise at the slower rate. By contrast, the figure for 55-64 age group showed a downward trend. Additionally, the figure for over 75 age group was lowest throughout the period.
Detail Sampel
the graph below shows the percentage of people in different age groups in one city who attended music concerts between 2010 and 2015.
20/07/2026 11:04 5.0 skor
Topik
the graph below shows the percentage of people in different age groups in one city who attended music concerts between 2010 and 2015.
Jumlah kata: 195
Grafik/Diagram
Essay
Skor Keseluruhan
5.0±0.5
Dasar
Skor Kriteria Writing
TA5.0
CC5.0
LR6.0
GRA5.0
Klik teks yang ditandai di esai untuk melihat saran detail untuk peningkatan.
Analisis mendalam
Task 1 - Academic Writing
4 tools available
Esai contoh - IELTS Writing Task 1
Belum ada esai contoh
Silakan klik tombol di bawah untuk menganalisis dan membuat esai contoh berkualitas tinggi untuk Task 1.