
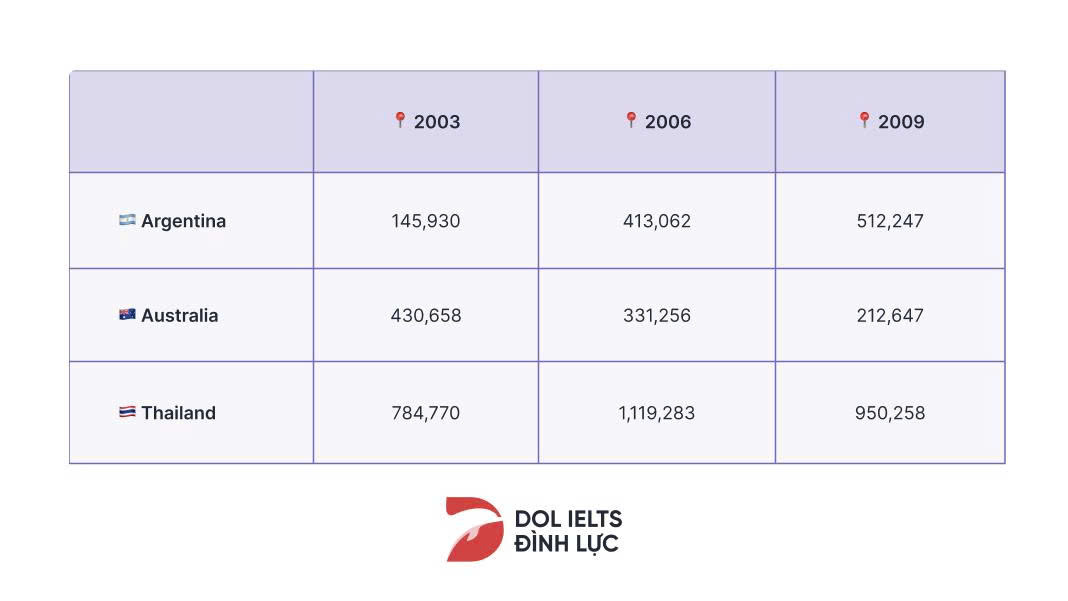
The table illustrates how many cars were made in three countries between 2003 and 2009. Overall, among all the nations, Thailand held the top spot during the entire surveyed period. What is also notable from the table is that Australia witnessed a downward trend whereas the remaining countries exhibited a contrasting pattern. At the start of the period, with approximately 785,000 cars, Thailand emerged as the leading nation. Far below was Australia, at around 431,000 cars. At the bottom of the list was Argentina, as its figure stood at just under 146,000 cars. Thereafter, the number of cars produced in Thailand increased dramatically to about 1.12 million cars in 2006 before a considerable decline to around 950,000 cars was recorded in 2009. Meanwhile, Australia saw a descending trend in the figure, with a significant drop to roughly 213,000 cars in 2009. In contrast, there was a sharp rise in the data for cars produced in Argentina, reaching slightly over 521,000 cars at the end of the surveyed years.
รายละเอียดตัวอย่าง
The table shows the number of cars made in three countries from 2003 to 2009. Summarise the information by selecting and reporting the main features, and make comparisons where relevant.
20/07/2026 11:26 7.0 คะแนน
หัวข้อ
The table shows the number of cars made in three countries from 2003 to 2009. Summarise the information by selecting and reporting the main features, and make comparisons where relevant.
จำนวนคำ: 168
แผนภูมิ/กราฟ
Essay
คะแนนรวม
7.0±0.5
ดีมาก
คะแนนเกณฑ์การเขียน
TA7.0
CC7.0
LR7.0
GRA7.0
คลิกข้อความที่ไฮไลต์ในเรียงความเพื่อดูคำแนะนำรายละเอียดเพื่อพัฒนา
การวิเคราะห์เชิงลึก
Task 1 - Academic Writing
4 tools available
บทความตัวอย่าง - IELTS Writing Task 1
ยังไม่มีบทความตัวอย่าง
กดปุ่มด้านล่างเพื่อวิเคราะห์และสร้างบทความตัวอย่างคุณภาพสูงสำหรับ Task 1