
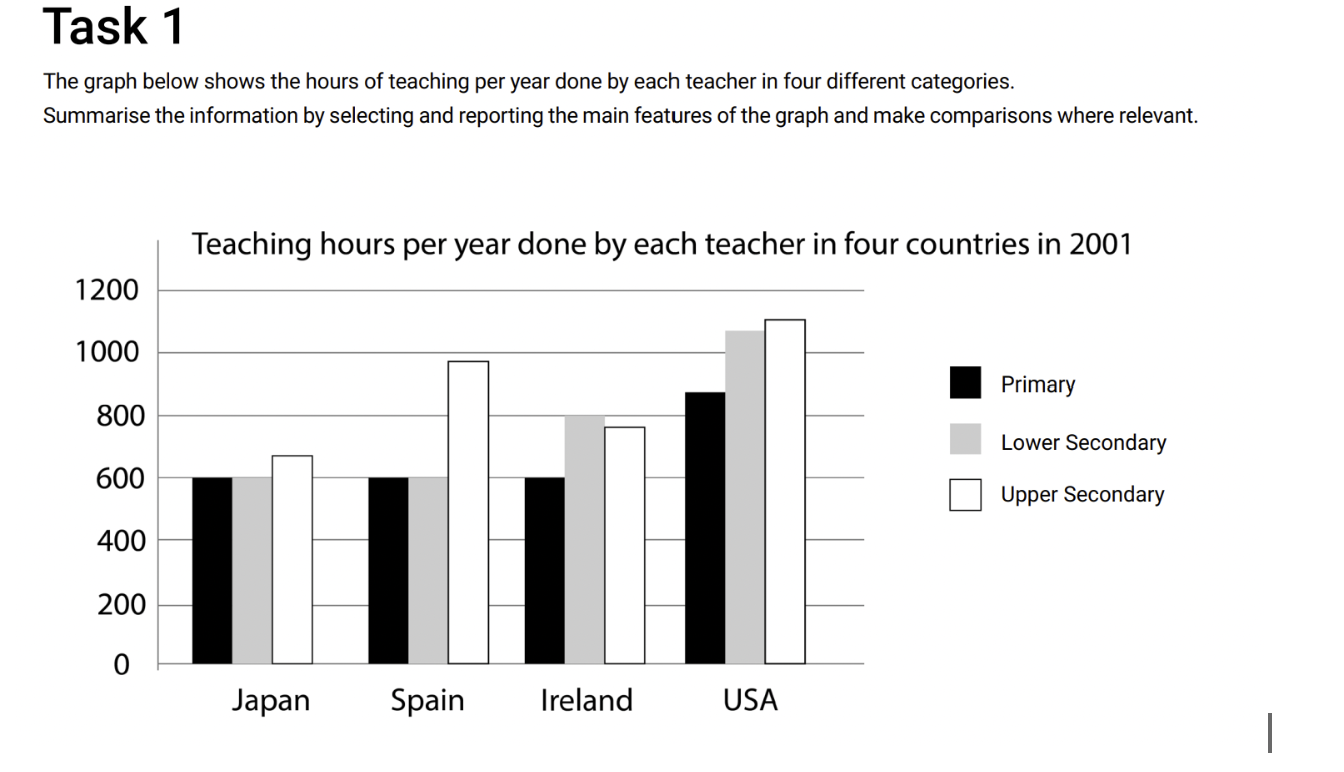
The bar chart illustrates how many hours teachers taught annually at three levels of education across four different countries. Overall, upper secondary teachers recorded the highest annual teaching hours in all four countries except Ireland, where lower secondary teachers taught for longer. Additionally, teachers in the USA dominated the highest number of teaching hours across all three educational levels. In 2001, upper secondary teachers in the USA taught around 1,100 hours per year. This was followed by lower secondary teachers, who taught slightly fewer than 1,100 hours. By comparison, primary teachers in the USA recorded fewer than 900 teaching hours annually. In Ireland, annual teaching hours at both lower and upper secondary levels stood at approximately 800 hours, whereas primary teachers taught only around 600 hours per year. On the other hand, teaching workload at both primary and upper secondary levels in Japan and Spain taught around 600 hours in 2001. Similarly, upper secondary teaching hours in Japan recorded around 600, whereas educational level teachers in Spain spent approximately 1000 hours for teaching.
Sample Detail
The bar graph compares that how many hours teachers teached per year in four categories in four different countries.
20/07/2026 11:36 6.5 points
Topic
The bar graph compares that how many hours teachers teached per year in four categories in four different countries.
Word count: 173
Chart/Graph
Essay
Overall Scores
6.5±0.5
Fair
Writing Criteria Scores
TA6.0
CC7.0
LR7.0
GRA7.0
Click on any highlighted text in the essay to view detailed suggestions for improvement.
Deep Analysis
Task 1 - Academic Writing
4 tools available
Sample Essay - IELTS Writing Task 1
No sample essay
Click the button below to analyze and generate a high-quality sample essay for Task 1.