
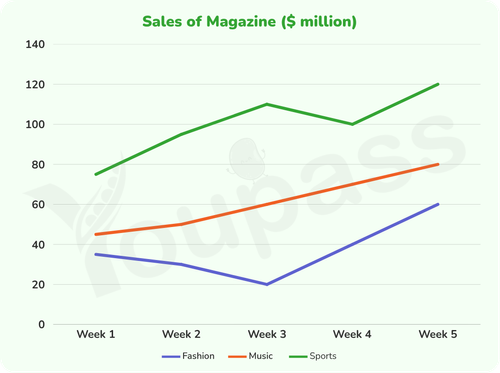
The line graph illustrates the revenue of three types of magazines, including fashion, music and sports in a certain area more than five weeks. Overall, it can be seen that there are fluctuations in sales of most categories, with the exception of music. Sports remain the type with the leading figures over the course of five weeks. In first three weeks, there is a significant increase of $35 million in sports' sales, from $75 million to $110 million, while the revenue of fashion experiences a moderate decline to $20 million. Moreover, in this period, the sales of music remain relatively stable by nearly $20 million to $60 million. In week 4, there is a climb of $10 million in music's sales, which is approximately $30 million higher than those of fashion. However, the revenue of sports witness a slight drop of $10 million. In week 5, sports' revenue reaches a peak of $120 million, dramatically higher than that of music and fashion, at $80 million and at $60 million, respectively.
नमूना विवरण
The chart below shows sales of three categories of magazines (fashion, music, and sports) in a particular region over five weeks. Summarise the information by selecting and reporting the main features, and make comparisons where relevant.
20/07/2026 11:55 7.0 अंक
विषय
The chart below shows sales of three categories of magazines (fashion, music, and sports) in a particular region over five weeks. Summarise the information by selecting and reporting the main features, and make comparisons where relevant.
शब्दों की संख्या: 170
चार्ट/ग्राफ
Essay
समग्र स्कोर
7.0±0.5
अच्छा
राइटिंग मानदंड स्कोर
TA7.0
CC7.0
LR7.0
GRA7.0
सुधार के विस्तृत सुझाव देखने के लिए लेख में किसी भी हाइलाइट किए गए टेक्स्ट पर क्लिक करें।
गहन विश्लेषण
Task 1 - Academic Writing
4 उपकरण उपलब्ध
नमूना लेख - IELTS Writing Task 1
कोई नमूना लेख नहीं
Task 1 के लिए उच्च-गुणवत्ता वाला नमूना लेख विश्लेषण और बनाने के लिए नीचे दिए गए बटन पर क्लिक करें।