
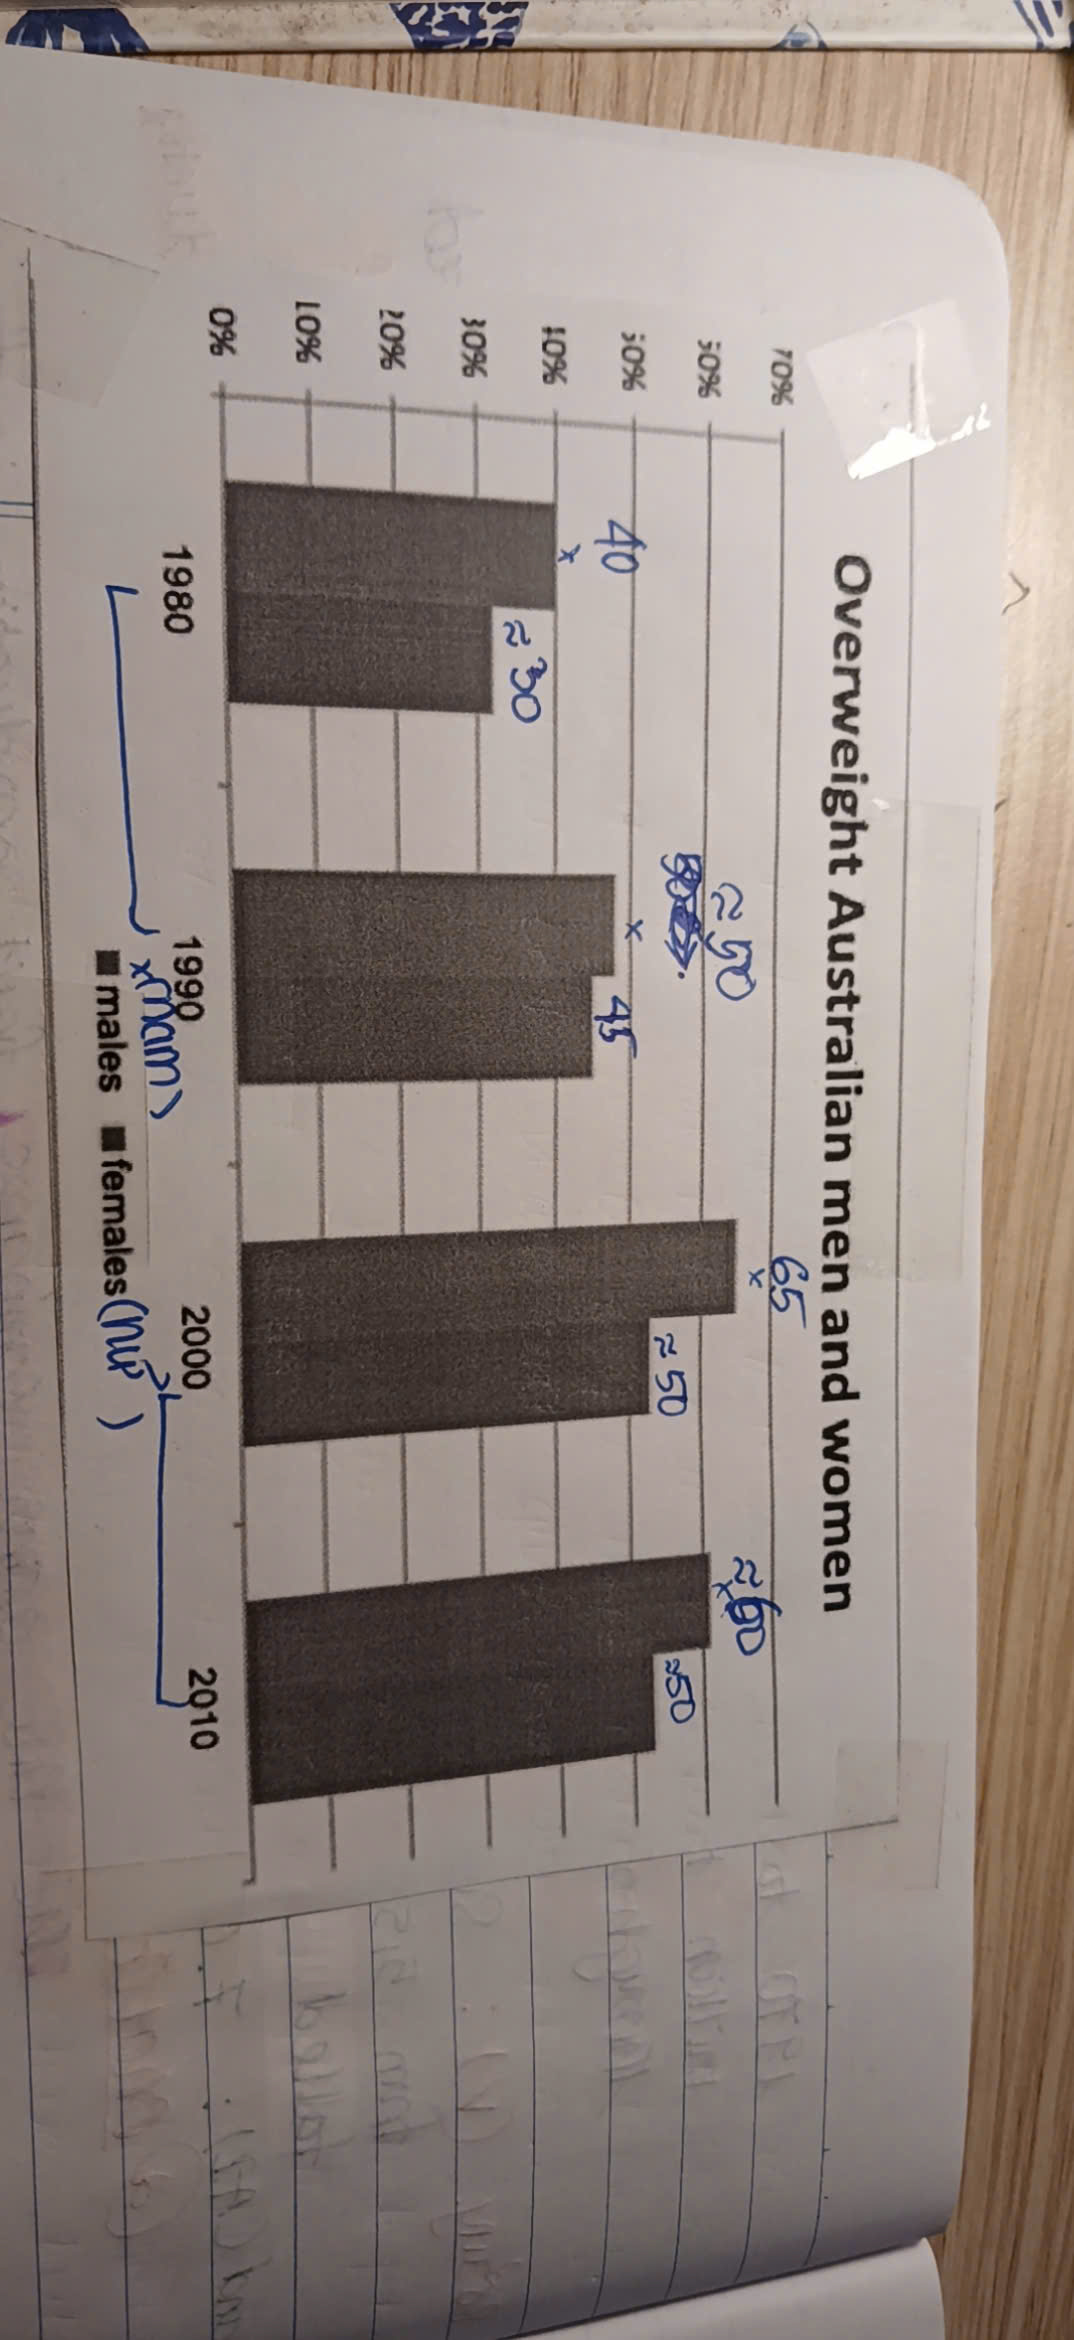
The bar chart reveal the percentage of overweight Australian men and woman over a 30 year period. Overall, the proportion of overweight Australian men grew over time, reaching its peak at 2000 with 65%. It reduces minimally in 2010 which in contrast to the Australian women maintained its value from the previous 10 year interval. The female rate of overweight experienced an upward trend just like that of the Australian men but it values was slightly lower than that of the men. Firstly, the men proportion over the years were 40%, 50%,65%, and 60% in 1980,1990,2000 and 2010 respectively while that of the women were 30%,45%,50% and 50% in the same succession of years as the Australian men. Notably, in 1990, The proportion of both the Australian men and woman almost hit the same value. Moreover, there was an equilibrium in the values of Australian woman being overweight in 2000 and 2010,.
รายละเอียดตัวอย่าง
The bar chart gives information about overweight Australian men and women
20/07/2026 12:14 5.5 คะแนน
หัวข้อ
The bar chart gives information about overweight Australian men and women
จำนวนคำ: 152
แผนภูมิ/กราฟ
Essay
คะแนนรวม
5.5±0.5
พื้นฐาน
คะแนนเกณฑ์การเขียน
TA6.0
CC6.0
LR6.0
GRA5.0
คลิกข้อความที่ไฮไลต์ในเรียงความเพื่อดูคำแนะนำรายละเอียดเพื่อพัฒนา
การวิเคราะห์เชิงลึก
Task 1 - Academic Writing
4 tools available
บทความตัวอย่าง - IELTS Writing Task 1
ยังไม่มีบทความตัวอย่าง
กดปุ่มด้านล่างเพื่อวิเคราะห์และสร้างบทความตัวอย่างคุณภาพสูงสำหรับ Task 1