
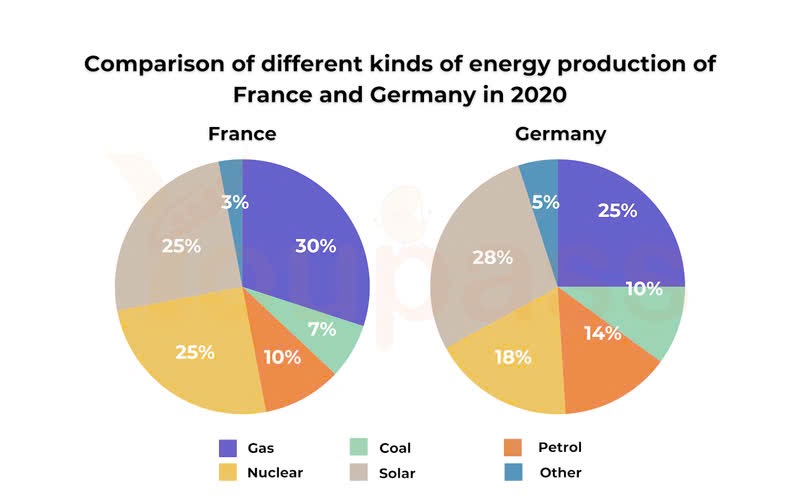
The pie charts compare the distribution of six distinct energy sources between France and Germany in 2020. Overall, the composition of the power sources was unevenly distributed in both European nations. Gas, nuclear, and solar accounted for the largest shares, making those the three most utilized fuels. Gas, nuclear, and solar constituted the bulk of the energy generations; however there were different leads in the two countries. France mainly harnessed natural gas as the figure recorded was 30%, whereas that in Germany was 25%. Germany preferred the sole renewable energy source, as the figure for solar accounted for 28%, which was 3% more than France. By contrast, France’s proportion of nuclear power surpassed Germany’s by 3%, standing at 25% and 18%, respectively. Petrol, coal, and other sources constituted only a negligible proportion, forming the lower group. The figures for petrol and coal in both nations ranged from 7% to 14%, with the remaining category having the least percentages, recorded at 3% and 5%.
รายละเอียดตัวอย่าง
The pie charts below show the comparison of different kinds of energy production of France and Germany in 2020. Summarise the information by selecting and reporting the main features, and make comparisons where relevant.
20/07/2026 12:22 7.0 คะแนน
หัวข้อ
The pie charts below show the comparison of different kinds of energy production of France and Germany in 2020. Summarise the information by selecting and reporting the main features, and make comparisons where relevant.
จำนวนคำ: 163
แผนภูมิ/กราฟ
Essay
คะแนนรวม
7.0±0.5
ดีมาก
คะแนนเกณฑ์การเขียน
TA7.0
CC7.0
LR7.0
GRA7.0
คลิกข้อความที่ไฮไลต์ในเรียงความเพื่อดูคำแนะนำรายละเอียดเพื่อพัฒนา
การวิเคราะห์เชิงลึก
Task 1 - Academic Writing
4 tools available
บทความตัวอย่าง - IELTS Writing Task 1
ยังไม่มีบทความตัวอย่าง
กดปุ่มด้านล่างเพื่อวิเคราะห์และสร้างบทความตัวอย่างคุณภาพสูงสำหรับ Task 1