
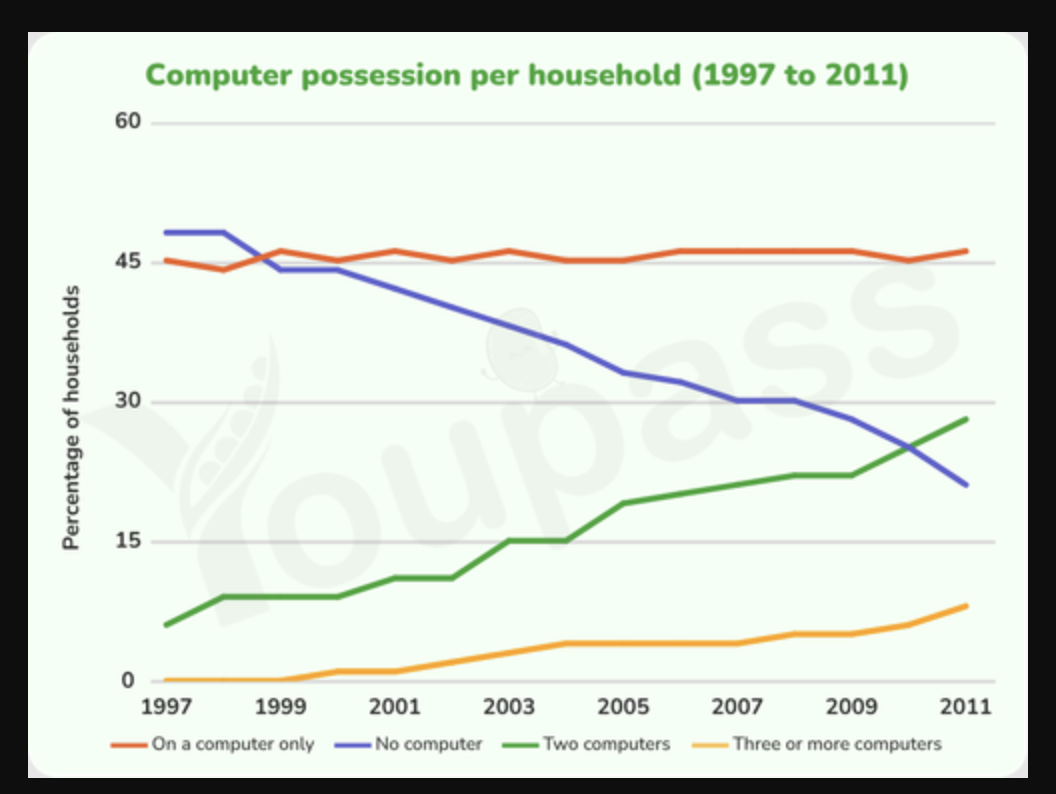
The given line graph illustrates the average percentage of computer ownership in a specific European country from 1997 to 2011. Overall, it is obvious that almost all households owned only one computer, and this trend constantly levelled off over 14 years. Whereas, while a marginal upward trend was witnessed in the proportion of households having multiple computers, the percentage of families without a modern computer significantly declined from the leading position to nearly modest, reflecting a wide range of technological usage. Looking more closely at the figure for families who had a single computer, beginning with the second-largest position at above 46%, it experienced negligible fluctuations and sustainably maintained over 46% for 14 years before ending in the leading position at 45%. Meanwhile, although computer-free households made up the majority of computer possession in the first year, at around 48%, it dropped dramatically to 18% after 14 years, widening the disparity between those and the figure for one-computer households. Regarding the remaining categories, a negligible proportion was seen in families who were in possession of two computers and more than three computers, at 8% and 0% respectively. After 14 years, while three or more computer households clearly emerged and escalated remarkably to 8%, ranking modest at the end of this period, the percentage of households which owned two computers recorded a similar pattern with an incredible climb to nearly 30%, indicating a far higher prevalence.
नमूना विवरण
The graph below gives information about computer possession by household in one European country between 1997 and 2011. Summarise the information by selecting and reporting the main features, and make comparisons where relevant.
20/07/2026 12:37 6.0 अंक
विषय
The graph below gives information about computer possession by household in one European country between 1997 and 2011. Summarise the information by selecting and reporting the main features, and make comparisons where relevant.
शब्दों की संख्या: 235
चार्ट/ग्राफ
Essay
समग्र स्कोर
6.0±0.5
ठीक
राइटिंग मानदंड स्कोर
TA6.0
CC6.0
LR7.0
GRA6.0
सुधार के विस्तृत सुझाव देखने के लिए लेख में किसी भी हाइलाइट किए गए टेक्स्ट पर क्लिक करें।
गहन विश्लेषण
Task 1 - Academic Writing
4 उपकरण उपलब्ध
नमूना लेख - IELTS Writing Task 1
कोई नमूना लेख नहीं
Task 1 के लिए उच्च-गुणवत्ता वाला नमूना लेख विश्लेषण और बनाने के लिए नीचे दिए गए बटन पर क्लिक करें।