
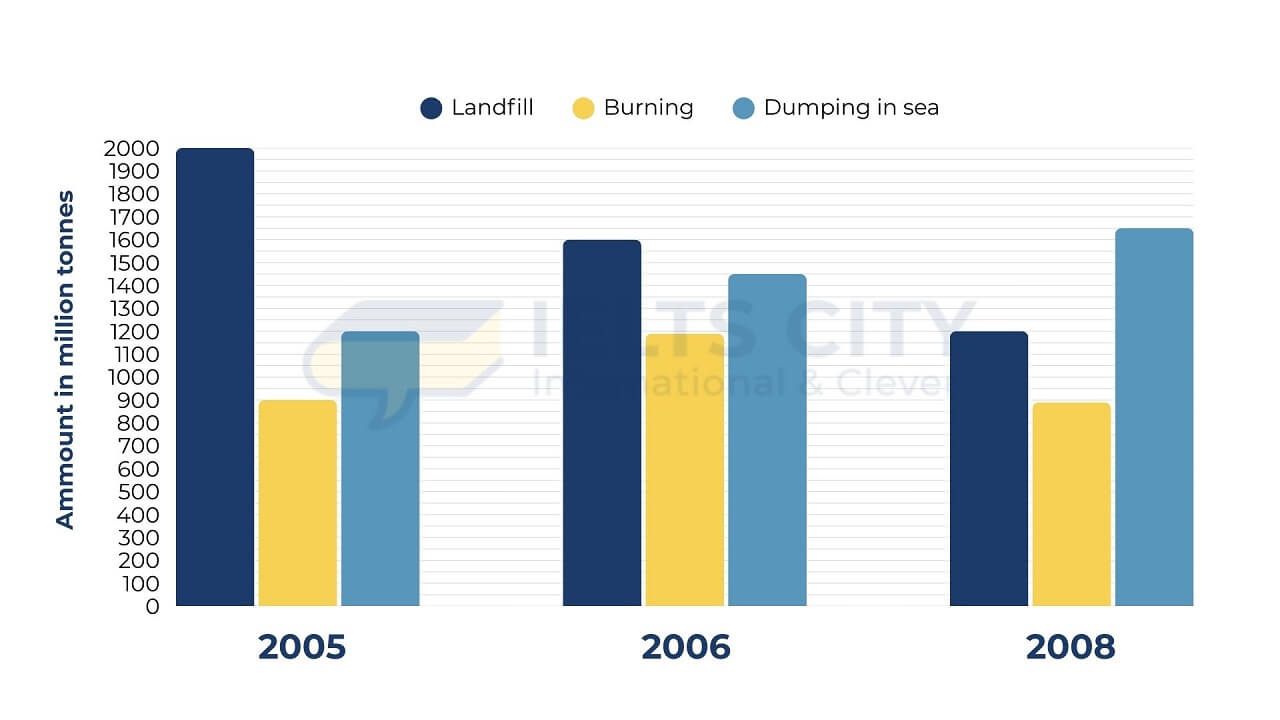
The bar chart illustrates dissimilar ways of treating waste in a European nation between 2005 and 2008. Overall, the amount of landfill waste had down trend, while there was a slight increase from dumping in sea throughout the period. Landfill recorded the highest levels with 2000 million tons in 2005, however over the 3 years, this figure dropped significantly, reaching 1200 million tons by 2008. While there was a sharp rise from 1200 to 1600 million tons in the statistic of dumping in sea between 2005 to 2008. In addition, dumping method surpassed landfill to became the most popular means of dealing with trash in 2008. Although the amount of burning way with 900 billion tons in 2005 and reached a peak of over 1100 million tons in 2006, after declining from the largest point to nearly 800 million tons. Throughout the process, the chart shows the information that burning methods remained at the middle of the levels in different ways to solve waste.
Detail Sampel
The chart below shows different methods of waste disposal in a European country from 2005 to 2008. Summarise the information by selecting and reporting the main features and make comparision where relevant.
20/07/2026 12:45 6.0 skor
Topik
The chart below shows different methods of waste disposal in a European country from 2005 to 2008. Summarise the information by selecting and reporting the main features and make comparision where relevant.
Jumlah kata: 164
Grafik/Diagram
Essay
Skor Keseluruhan
6.0±0.5
Cukup
Skor Kriteria Writing
TA6.0
CC6.0
LR6.0
GRA6.0
Klik teks yang ditandai di esai untuk melihat saran detail untuk peningkatan.
Analisis mendalam
Task 1 - Academic Writing
4 tools available
Esai contoh - IELTS Writing Task 1
Belum ada esai contoh
Silakan klik tombol di bawah untuk menganalisis dan membuat esai contoh berkualitas tinggi untuk Task 1.