
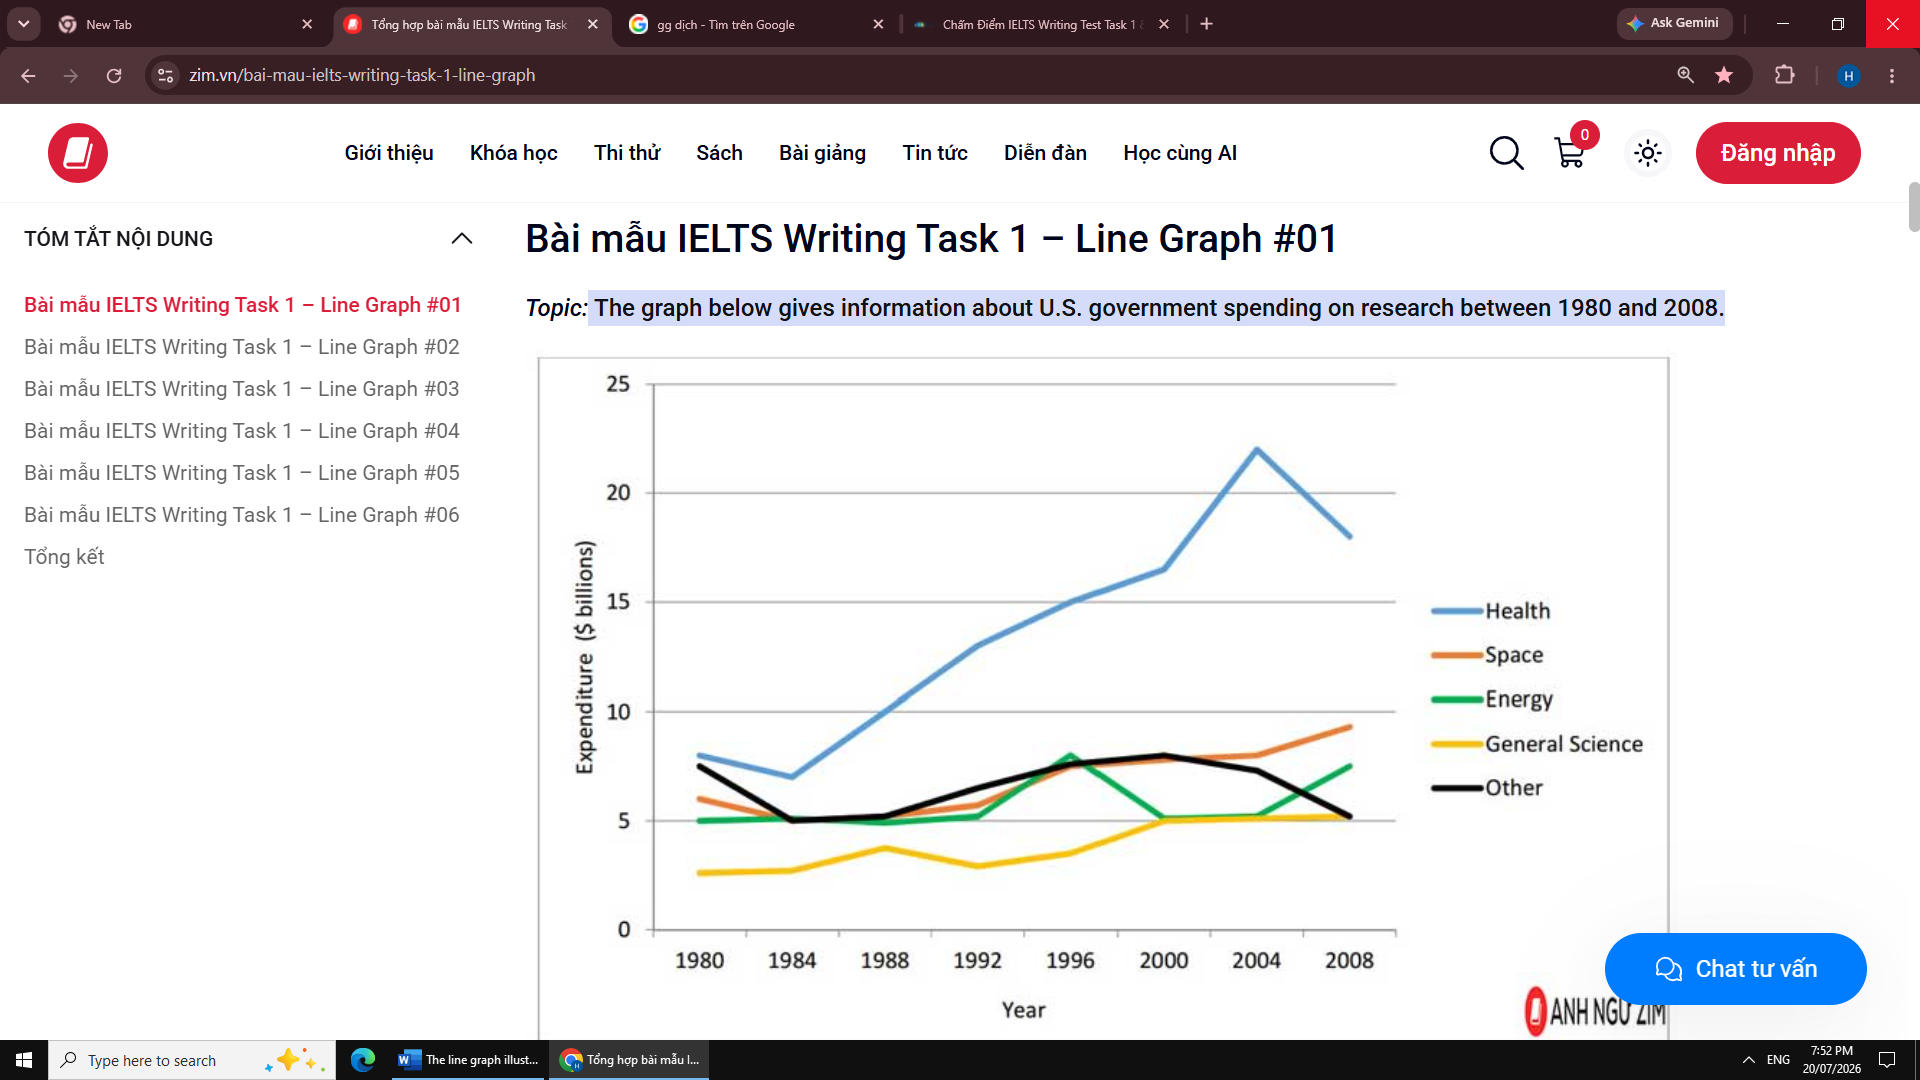
The line graph illustrated the information of US government’s consumer expenditure on diffirent fields, including Health, Space, Energy, General Science and other from 1980 to 2008. It is clear that while the total money of U.S. government spent on Health accounted for the highest values, the figures for General Science was lowest during the period. However, Space, Energy and other experianced a considerably flactuation. It can be seen that before witnessing a significant decreasing to approxiately 18 billions in 2008, U.S. government spending on research into Health increased dramaticaly from nearly $5.5 billion (1984) to reach a peak over $20 billion (2004), expenditure on Health was by far the highest. In constract, althought the amount of money on General Science also tended to increase, it hit the lowest point in overall. General Science increased gradually, beginning at $2.5 billion (1980) and rising slight by about 5% (2000 to 2008). Meanwhile, the figure for U.S. government’s expenditure on research on both Space and Energy seen a significant grow, from approximately $6 billion and $5 billion in 1980 to around $9 billion and $7.5 billion. In contrast, only other areas experience a decrease in spending on research from $7.5 billion in 1980, only $5 billion remains in 2008.
Detail Sampel
The graph below gives information about U.S. government spending on research between 1980 and 2008.
20/07/2026 12:54 6.0 skor
Topik
The graph below gives information about U.S. government spending on research between 1980 and 2008.
Jumlah kata: 206
Grafik/Diagram
Essay
Skor Keseluruhan
6.0±0.5
Cukup
Skor Kriteria Writing
TA6.0
CC6.0
LR6.0
GRA6.0
Klik teks yang ditandai di esai untuk melihat saran detail untuk peningkatan.
Analisis mendalam
Task 1 - Academic Writing
4 tools available
Esai contoh - IELTS Writing Task 1
Belum ada esai contoh
Silakan klik tombol di bawah untuk menganalisis dan membuat esai contoh berkualitas tinggi untuk Task 1.