
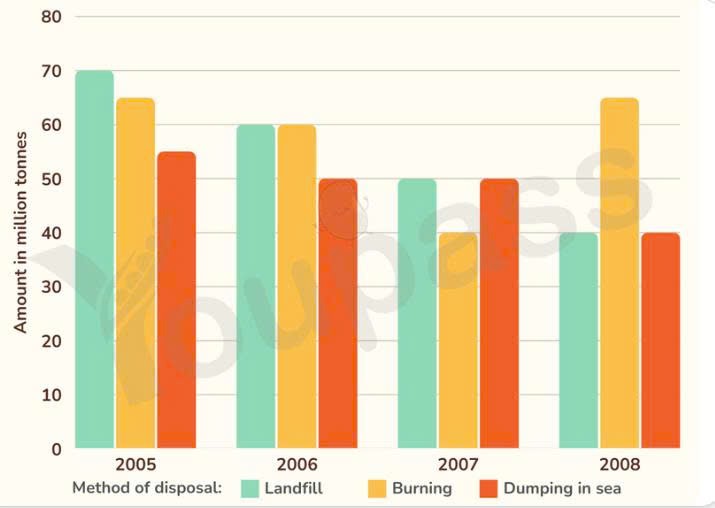
The bar chart compares different methods of waste disposal including Landfill, Burning and Dumping in sea, in a European country over the period of 3 years since 2005. Overall, while the figure on burning remained stable, the number at landfill and dumping in sea decreased. Regarding landfill, in the first year of the period, the number was the highest, at 70 million tonnes. There was a slow upward trend in the number to 50 million tonnes in 2007. For the rest of the period, the figure continued to fall steadily to 40 million tonnes. In terms of dumping in sea, this method of waste stayed the same at 50 million tonnes, between 2006 and 2007. At the end of the period, it witnessed a gradual downward trend to 40 million tonnes. Concerning burning, at the beginning of the period, the figure was the second highest compared to the other methods of waste, at 65 million tonnes. The number declined slightly to 60 million tonnes in the next year. Until 2008, it witnessed a gradual growth back to 65 million tonnes.
รายละเอียดตัวอย่าง
The chart below shows different methods of waste disposal in a European country from 2005 to 2008. Summarise the information by selecting and reporting the main features, and make comparisons where relevant.
20/07/2026 13:03 5.5 คะแนน
หัวข้อ
The chart below shows different methods of waste disposal in a European country from 2005 to 2008. Summarise the information by selecting and reporting the main features, and make comparisons where relevant.
จำนวนคำ: 180
แผนภูมิ/กราฟ
Essay
คะแนนรวม
5.5±0.5
พื้นฐาน
คะแนนเกณฑ์การเขียน
TA4.0
CC6.0
LR6.0
GRA6.0
คลิกข้อความที่ไฮไลต์ในเรียงความเพื่อดูคำแนะนำรายละเอียดเพื่อพัฒนา
การวิเคราะห์เชิงลึก
Task 1 - Academic Writing
4 tools available
บทความตัวอย่าง - IELTS Writing Task 1
ยังไม่มีบทความตัวอย่าง
กดปุ่มด้านล่างเพื่อวิเคราะห์และสร้างบทความตัวอย่างคุณภาพสูงสำหรับ Task 1