
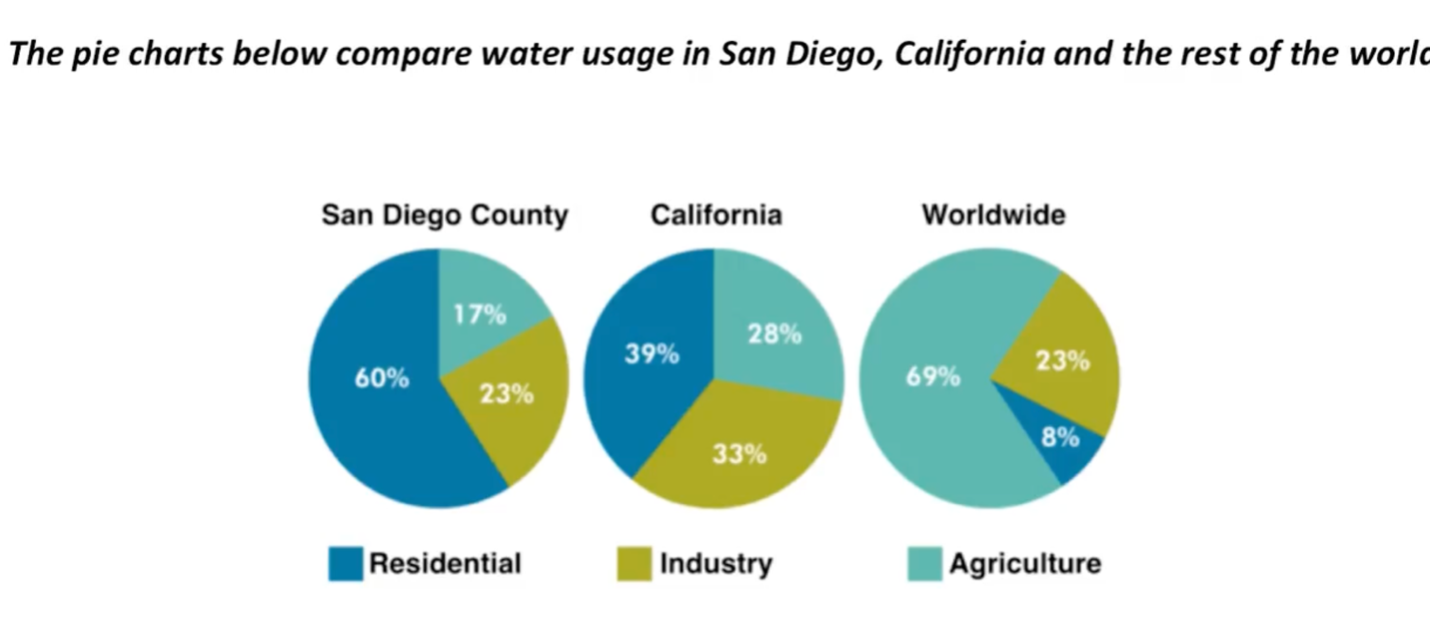
The three pie charts show the amount of water consumed for three different sectors ( residential, industry and agriculture) in San Diego, California and the world as a whole. Overall, in San Diego and California, water used for the residential sector accounts for the highest proportion. By contrast, Agriculture consumes the vast majority of water used in the world. In San Diego and California, water usage for household takes up 60% and 39% respectively. Water use for this sector in the rest of the world is a mere 8%. The opposite trend can be seen when we look at the amount of water used for agriculture. While this sector stands at 69% of global water use, the corresponding figures for San Diego and California drop to 17% and 28% respectively. Turning to the remaining sector, water consumption for the industrial sector in San Diego matches the world precisely at 23%, whereas the figure for California is slightly higher, at 33%
Detail Sampel
The pie charts below compare water usage in San Diego, California and the rest of the world
20/07/2026 16:26 7.5 skor
Topik
The pie charts below compare water usage in San Diego, California and the rest of the world
Jumlah kata: 160
Grafik/Diagram
Essay
Skor Keseluruhan
7.5±0.5
Baik
Skor Kriteria Writing
TA8.0
CC8.0
LR7.0
GRA7.0
Klik teks yang ditandai di esai untuk melihat saran detail untuk peningkatan.
Analisis mendalam
Task 1 - Academic Writing
4 tools available
Esai contoh - IELTS Writing Task 1
Belum ada esai contoh
Silakan klik tombol di bawah untuk menganalisis dan membuat esai contoh berkualitas tinggi untuk Task 1.