
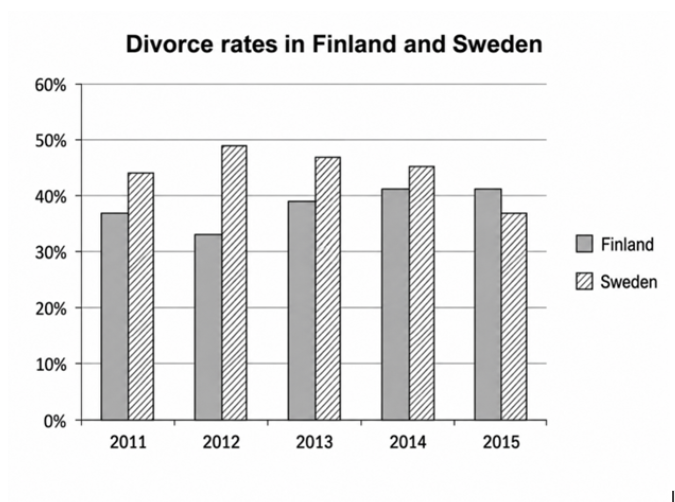
Given is the bar chart demonstrating the proportion of divorce cases in 2 European nations, Finland and Sweden, between 2011 and 2015. Overall, two contrasting patterns can be observed; the proportion of divorce rates in Sweden witnessed an increase followed by a steady decline, while the opposite trend was true for Finland. Another key feature is that Sweden was the highest for most of the given period. From 2011 to 2012, the divorce rates in Finland went through a modest drop of 3%, falling from nearly 36% to 33%. In contrast, there was a significant rise in the figure for Sweden, growing from approximately 43% to about 49%, reaching its all-time peak. During the remaining period, the pattern reversed; Sweden’s divorce rates experienced a downward trend, dropping sharply from 47% to just around 37% in the final year. Meanwhile, Finland saw a gradual rise from 39% to over 40% and remained unchanged in 2015, surpassing Sweden to record a higher divorce rate.
Sample Detail
You should spend about 20 minutes on this task. The bar chart shows the divorce rates in two European countries from 2011 to 2015. Summarise the information by selecting and reporting the main features and make comparisons where relevant. Write at least 150 words.
20/07/2026 16:35 7.5 points
Topic
You should spend about 20 minutes on this task. The bar chart shows the divorce rates in two European countries from 2011 to 2015. Summarise the information by selecting and reporting the main features and make comparisons where relevant. Write at least 150 words.
Word count: 162
Chart/Graph
Essay
Overall Scores
7.5±0.5
Good
Writing Criteria Scores
TA7.0
CC8.0
LR7.0
GRA8.0
Click on any highlighted text in the essay to view detailed suggestions for improvement.
Deep Analysis
Task 1 - Academic Writing
4 tools available
Sample Essay - IELTS Writing Task 1
No sample essay
Click the button below to analyze and generate a high-quality sample essay for Task 1.