
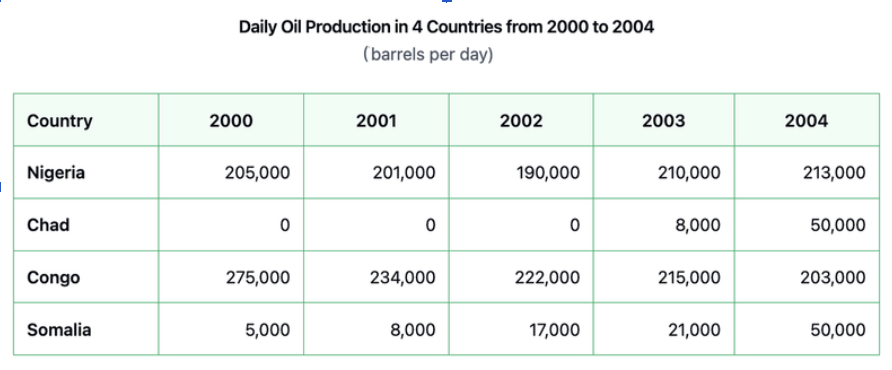
The table illustrates how many barrels of oil were produced on a daily basis in four different countries between 2000 and 2004. Overall, almost all nations saw varying degrees of growth in daily oil output, except for Congo, which saw a net decline. Notwithstanding this, Congo was the largest producer for the majority of the period, except for the last year, when it was surpassed by Nigeria. Nigeria saw a negligible relative increase, despite its somewhat erratic pattern. This country produced 205,000 barrels of oil per day, surpassing the other two rising producers by a significant margin. Two years later, the country’s production was at its worst, with oil output falling to 190,000 barrels per day (bpd), before rebounding to 213,000 bpd in 2004. More significant proportional growth was focused on Chad and Somalia. Not until 2003 did the former country start producing oil, with an initial output of 8,000 bpd. However, within just one year, production surged to its highest point of 50,000 bpd, representing a sixfold overall rise. An even more pronounced increase was seen in Somalia, where daily oil production expanded tenfold, from 5,000 bpd initially, to reach parity with Chad’s closing figure at the end of the period. Finally, only in Congo did production fall, producing 275,000 barrels of oil per day in 2000. From this point onwards, daily oil output suffered a consistent decline, contracting to 203,000 barrels in 2004. This decline thus dragged this country down as the second largest producer at the end of the period, ceding its initial dominance to the rising Nigerian production.
नमूना विवरण
The table below shows daily oil production in 4 countries from 2000 to 2004. Summarize the information by selecting and reporting the main features and make comparisons where relevant.
20/07/2026 16:47 6.5 अंक
विषय
The table below shows daily oil production in 4 countries from 2000 to 2004. Summarize the information by selecting and reporting the main features and make comparisons where relevant.
शब्दों की संख्या: 262
चार्ट/ग्राफ
Essay
समग्र स्कोर
6.5±0.5
ठीक
राइटिंग मानदंड स्कोर
TA5.0
CC7.0
LR7.0
GRA8.0
सुधार के विस्तृत सुझाव देखने के लिए लेख में किसी भी हाइलाइट किए गए टेक्स्ट पर क्लिक करें।
गहन विश्लेषण
Task 1 - Academic Writing
4 उपकरण उपलब्ध
नमूना लेख - IELTS Writing Task 1
कोई नमूना लेख नहीं
Task 1 के लिए उच्च-गुणवत्ता वाला नमूना लेख विश्लेषण और बनाने के लिए नीचे दिए गए बटन पर क्लिक करें।