
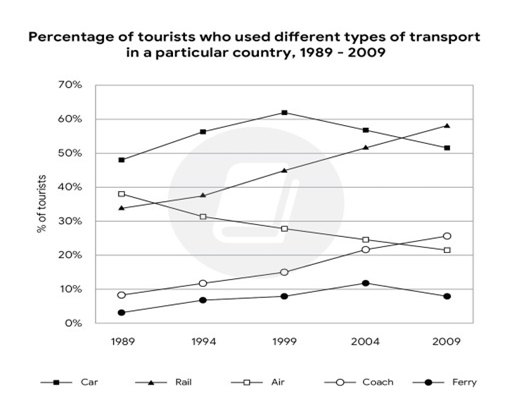
The line chart illustrates the proportion of visitors using varying types of transport in a specific country from 1989 to 2009. Overall, car and rail transport were the two most common ways to travel among five options throughout the period. Additionally, there were some shifts in ranking, specifically rail category surpassing air and car, and coach overtaking air, with exception of ferry that it remained the least popular by the end. Beginning at about 48% in 1989, the percentage of tourists travelling by car had a notable increase of 14% after a decade, reaching the peak in 1999 before dropping to only 52% at the end. The figure for railway transport kept growing during the period, from roughly 34% in 1989 to nearly 58% in 2009. During this period, it surpassed air transport and car, to become the most popular transport. The proportion of visitors using airway transport was the only mode of transport which witnessed a downward trend over the twenty-year period. At the initial year 1989, it started at the second position at about 38%. Afterwards, air group dropped gradually to nearly 30% in 1994, around 28% in 1999, 25% in 2004, and ended approximately 20% in 2009. Throughout this period, it was overtaken by coach group in between 2004 and 2009, which increased continuously from under 10% in 1989 to about 25% in 2009. In particular, although the total of people travelling by ferry experienced a modest growth during the first sixteen years before falling to only 8% in 2009, it stayed steadily at the lowest position after twenty years.
नमूना विवरण
The graph below shows the percentages of tourists who used different types of transport to travel within a particular nation between 1989 and 2009.
20/07/2026 16:48 7.0 अंक
विषय
The graph below shows the percentages of tourists who used different types of transport to travel within a particular nation between 1989 and 2009.
शब्दों की संख्या: 263
चार्ट/ग्राफ
Essay
समग्र स्कोर
7.0±0.5
अच्छा
राइटिंग मानदंड स्कोर
TA7.0
CC8.0
LR7.0
GRA7.0
सुधार के विस्तृत सुझाव देखने के लिए लेख में किसी भी हाइलाइट किए गए टेक्स्ट पर क्लिक करें।
गहन विश्लेषण
Task 1 - Academic Writing
4 उपकरण उपलब्ध
नमूना लेख - IELTS Writing Task 1
कोई नमूना लेख नहीं
Task 1 के लिए उच्च-गुणवत्ता वाला नमूना लेख विश्लेषण और बनाने के लिए नीचे दिए गए बटन पर क्लिक करें।