
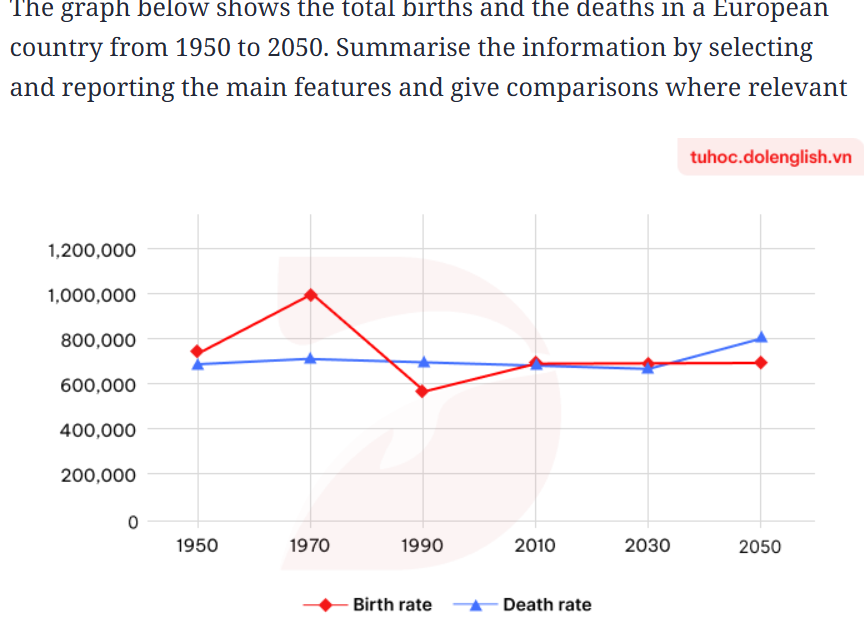
The given line graph compares the birth and death rate figures in a European country in a period of 100 years, starting from 1950 and including some predictions up to 2050. Overall, while the number of births undergoes a significant fluctuating upward trend throughout the period, few variations are observed in the death toll. Moreover, although the birth rate surpassed the mortality figures for the first 40 years, the latter are projected to exceed the birth rate for the remainder of the century At the beginning of the period, the birth figure was roughly 750,000 people, which was slightly higher than the 680,000 deaths. From this starting point, the number of babies born experienced a fluctuating trend when reaching its peak with 1,000,000 people before plummeting to its lowest point of below 600,000 within just 40 years. In stark contrast, the mortality rate remained relatively stable with about 700,000 deaths in 1970, then returning to the starting point in 1990. This year witnessed a crossover, with the number of deaths surpassing that of births for the first time in the period. Regarding the 60 remaining years of the century, both figures express sharp changes. The number of births increased to 750,000 people in 2010, momentarily converting with the death figure. This pattern is predicted to remain unchanged in 2030 before the mortality figures elascates to 800,000 in 2050 while the birth rate is likely to level off at 700,000 people.
নমুনা বিস্তারিত
The graph below shows the total births and the deaths in a European country from 1950 to 2050. Summarise the information by selecting and reporting the main features and give comparisons where relevant The given graph illustrates the number of births and deaths in a European country in a period of 100 years, from 1950 to 2020. Overall, while both categories shared the same starting point in 1950, birth rate experienced a more fluctuating trend than death rate over the time. While the number of people born was initially higher than that of dead people at some points, the death rate exceeded the birth rate in 1990 and is projected to continue by 2050. In 1950, both categories started with about 700,000 people. From this starting point, the number of babies born rocketed and reached its peak in 1970 with 1,000,000 people, before plunging to under 600,000 people in the next 10 years. In stark contrast, the death rate remained merely stable with about 710,000 in 1970 people then slightly dropped to the starting point in 1990. This year recorded the first time the number of people died surpassing the number of people born. The period from 1990 to 2050 shows a sharp change in both sectors. With about 600,000 people born in 1990, the birth rate increased to 700.000 people in 2010, which was similar to the death rate. This equal pattern is predicted to remain unchanged by 2030 before the death rate reaches 800.000 people by 2050, while the birth rate stays stable with 700.00 people at the same time.
টপিক বা বিষয়
The graph below shows the total births and the deaths in a European country from 1950 to 2050. Summarise the information by selecting and reporting the main features and give comparisons where relevant The given graph illustrates the number of births and deaths in a European country in a period of 100 years, from 1950 to 2020. Overall, while both categories shared the same starting point in 1950, birth rate experienced a more fluctuating trend than death rate over the time. While the number of people born was initially higher than that of dead people at some points, the death rate exceeded the birth rate in 1990 and is projected to continue by 2050. In 1950, both categories started with about 700,000 people. From this starting point, the number of babies born rocketed and reached its peak in 1970 with 1,000,000 people, before plunging to under 600,000 people in the next 10 years. In stark contrast, the death rate remained merely stable with about 710,000 in 1970 people then slightly dropped to the starting point in 1990. This year recorded the first time the number of people died surpassing the number of people born. The period from 1990 to 2050 shows a sharp change in both sectors. With about 600,000 people born in 1990, the birth rate increased to 700.000 people in 2010, which was similar to the death rate. This equal pattern is predicted to remain unchanged by 2030 before the death rate reaches 800.000 people by 2050, while the birth rate stays stable with 700.00 people at the same time.
চার্ট/গ্রাফ
Essay
সামগ্রিক স্কোর
ভালো
রাইটিং মানদণ্ড স্কোর
উন্নতির জন্য বিস্তারিত পরামর্শ দেখতে প্রবন্ধের হাইলাইট করা যেকোনো লেখায় ক্লিক করুন।
গভীর বিশ্লেষণ
Task 1 - Academic Writing
নমুনা রচনা - IELTS Writing Task 1
কোনো নমুনা রচনা নেই
টাস্ক ১-এর জন্য উচ্চমানের নমুনা রচনা বিশ্লেষণ এবং তৈরি করতে নিচের বাটনে ক্লিক করুন।