
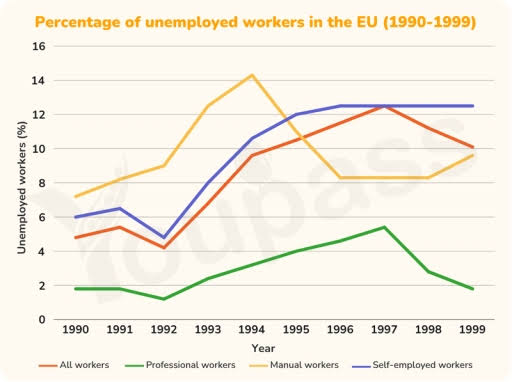
The line graph illustrates the porpotion of the citizens were out of work, namely all workers, professional workers, manual workers and self-employed workers, in a certain region throughout 9 years. Overall, it is clear that throughout 9 years, Manual workers and Self-employed workers increased by the end of the period. Meanwhile the data of All workers and Professional workers declined dramatically. Looking first at the two highest workers, Manual workers began at just under 8% in 1990, making it the most satisfied employees at that point. However, this figure reached a peak of 14% in 1994, before dropped steeply to around 8.1% in 1996 and then unchanged in 1998 until recovering to about 9% by 1999. Professional workers hit the low under 2% in the first period. After that, this number declined marginally approximately 1,9% in 1992, before surged at 5% 1997, then halved between 1998 to 1999 at 2%. As for All workers, the percentage stood at around 5% in 1990, and decreased slightly at 4%. However, this figure experienced a upward trend over the period from 1993 to 1996, slipped dramatically from 6% to 12% in 1997. Self-employed shows the satisfaction dropped gradually from about 5% in 1992, before rebounded to 13% in 1996 and remained stable until at the end of the period.
Detail Sampel
The graph below compares the percentage of unemployed workers in the European Union (all workers) with the percentages in the three categories, Professional, Manual and Self-employed. Summarise the information by selecting and reporting the main features, and make comparisons where relevant.
20/07/2026 16:59 5.0 skor
Topik
The graph below compares the percentage of unemployed workers in the European Union (all workers) with the percentages in the three categories, Professional, Manual and Self-employed. Summarise the information by selecting and reporting the main features, and make comparisons where relevant.
Jumlah kata: 216
Grafik/Diagram
Essay
Skor Keseluruhan
5.0±0.5
Dasar
Skor Kriteria Writing
TA5.0
CC5.0
LR5.0
GRA5.0
Klik teks yang ditandai di esai untuk melihat saran detail untuk peningkatan.
Analisis mendalam
Task 1 - Academic Writing
4 tools available
Esai contoh - IELTS Writing Task 1
Belum ada esai contoh
Silakan klik tombol di bawah untuk menganalisis dan membuat esai contoh berkualitas tinggi untuk Task 1.