
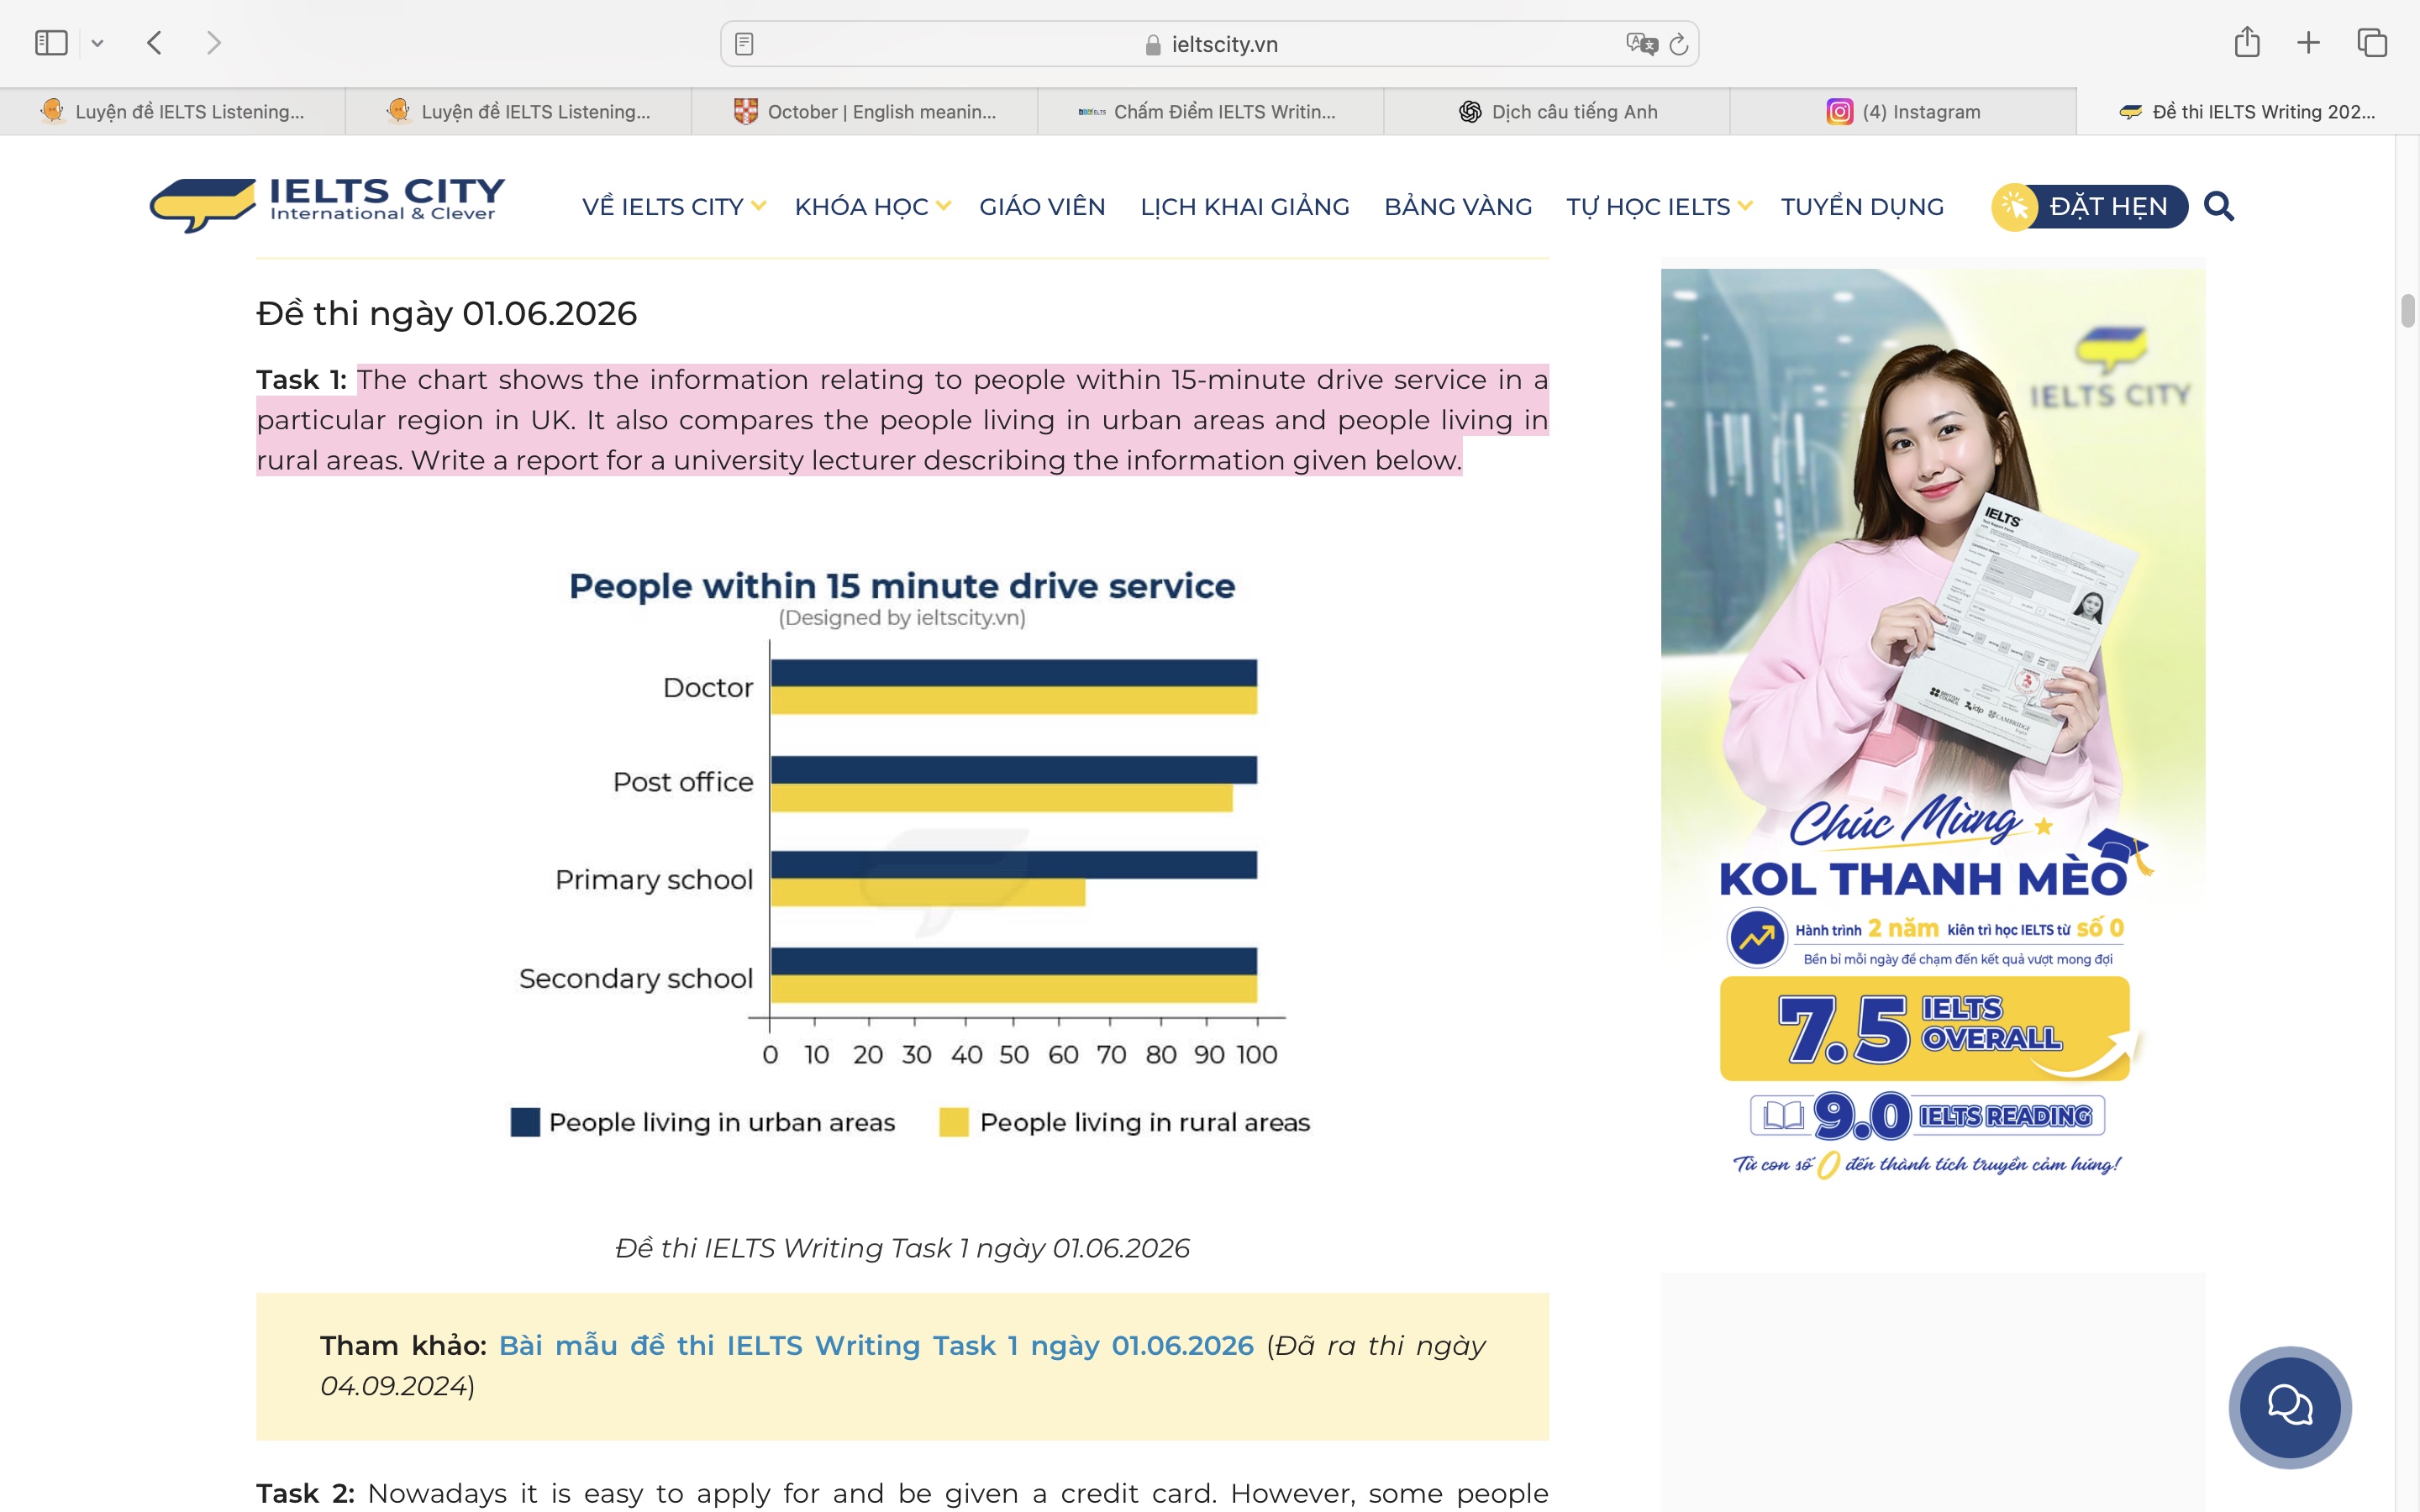
The chart compares the percentage of people living in urban and rural areas who have the tendency to access to four public services within 15 minute. Overall, while the figure for doctor and secondary school in both urban and rural areas were almost identical, urban people generally had better access to four drive services. Access to most services was high in both urban and rural areas. The proportion of doctor and secondary school were similar which could reach within 15 minute drive in both urban and rural ares, at around 100%. For the post office, approximately 100% of urban people could access, compared with around 95% of rural residents could be less 5% than urban residents. The largest differenced can be seen in accessing to primary school. In urban people, whereas the percentage of people remained stable, at about 100%, the figure for rural people was significant lower, at about 65% which was the lowest figure overall.
नमूना विवरण
The chart shows the information relating to people within 15-minute drive service in a particular region in UK. It also compares the people living in urban areas and people living in rural areas. Write a report for a university lecturer describing the information given below.
20/07/2026 17:00 6.0 अंक
विषय
The chart shows the information relating to people within 15-minute drive service in a particular region in UK. It also compares the people living in urban areas and people living in rural areas. Write a report for a university lecturer describing the information given below.
शब्दों की संख्या: 157
चार्ट/ग्राफ
Essay
समग्र स्कोर
6.0±0.5
ठीक
राइटिंग मानदंड स्कोर
TA6.0
CC6.0
LR6.0
GRA6.0
सुधार के विस्तृत सुझाव देखने के लिए लेख में किसी भी हाइलाइट किए गए टेक्स्ट पर क्लिक करें।
गहन विश्लेषण
Task 1 - Academic Writing
4 उपकरण उपलब्ध
नमूना लेख - IELTS Writing Task 1
कोई नमूना लेख नहीं
Task 1 के लिए उच्च-गुणवत्ता वाला नमूना लेख विश्लेषण और बनाने के लिए नीचे दिए गए बटन पर क्लिक करें।