
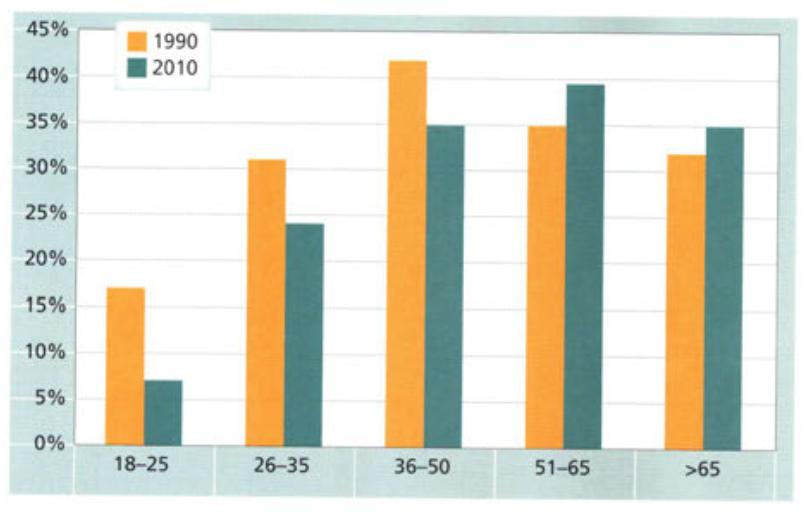
The bar chart illustrates the proportion of British residents donating money to charity by five different age groups in 1990 and 2010. Overall, while the percentages of people aged 36-50, 26-35 and 18-25 went down, those of 51-65 and 65+ groups increased over the period. Additonally, the percentage of people aged 18-25 was the lowest throughout the timeframe. In terms of decreasing trends, the figure for 36-50 age group, which was the highest at the beginning, declined relatively significantly from around 42% to 35% in 2010. Similarly, the percentage of people aged 26-35 experienced a sharp fall from above 30% to under 25%. Additionally, the figure for 18-25 age group suffered the most substantial drop from roughly 17% to nearly 7%. As for increasing trends, the percentage of people aged 51-65, which became highest at the end of the period, enjoyed a marginal growth from 35% to slightly below 40% Finally, there was the most negligible rise in the share of people aged more than 65 from almost 32% to 35%
Detail Sampel
The chart below gives information on the percentage of British people giving money to charity by age range for the years 1990 and 2010. Summarize the information by selecting and reporting the main features and make comparisons where relevant.
20/07/2026 17:13 7.0 skor
Topik
The chart below gives information on the percentage of British people giving money to charity by age range for the years 1990 and 2010. Summarize the information by selecting and reporting the main features and make comparisons where relevant.
Jumlah kata: 171
Grafik/Diagram
Essay
Skor Keseluruhan
7.0±0.5
Baik
Skor Kriteria Writing
TA7.0
CC7.0
LR7.0
GRA7.0
Klik teks yang ditandai di esai untuk melihat saran detail untuk peningkatan.
Analisis mendalam
Task 1 - Academic Writing
4 tools available
Esai contoh - IELTS Writing Task 1
Belum ada esai contoh
Silakan klik tombol di bawah untuk menganalisis dan membuat esai contoh berkualitas tinggi untuk Task 1.