
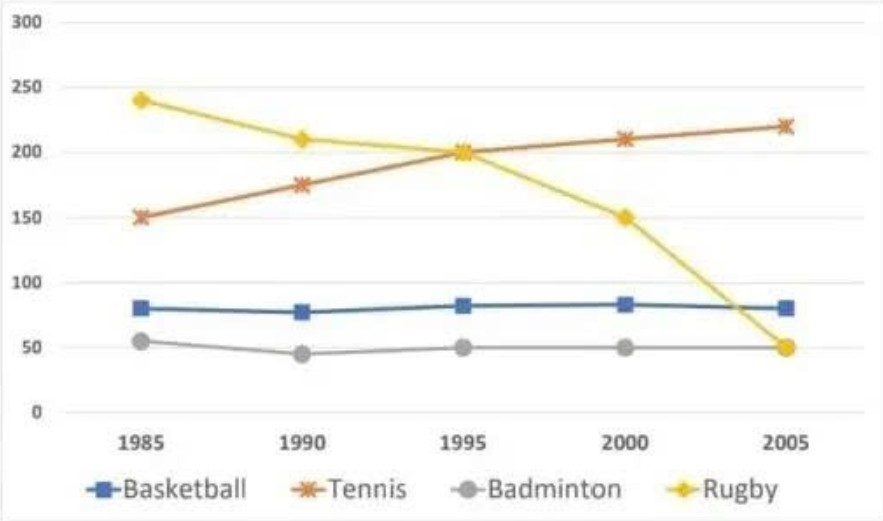
The line graph depicts the number of players in an athletics center in Britain between two years 1985 and 2005. Overall, it can be seen that the figure for participants in basketball and badminton remained stagnant throughout the year, while those of partners in tennis grew and rugby decreased in the period. In terms of the two genres that remained unchanged during the period, it was apparent that basketball was higher. In 1985, there were around 95 people who took part in basketball; however, the figure dropped slightly to 90 in the next 5 years. Eventually, the statistics saw a growth back to its starting point at the end of the period. Likewise, badminton had approximately 51 members in the first year of the period, and there was a slight decline throughout the next 5 years, ending the period with 50 people in 2005. On the other hand, the statistics for tennis received 150 participants in 1985, before jumping to 220 people at the end of the period. By contrast, the figure for people who joined rugby was approximately 240 members in 1985 before falling sharply to 50 people in 2005.
รายละเอียดตัวอย่าง
The line chart gives information about the participants in a sports center in Britain from 1985 to 2005.
20/07/2026 17:36 6.0 คะแนน
หัวข้อ
The line chart gives information about the participants in a sports center in Britain from 1985 to 2005.
จำนวนคำ: 191
แผนภูมิ/กราฟ
Essay
คะแนนรวม
6.0±0.5
ดีพอใช้
คะแนนเกณฑ์การเขียน
TA6.0
CC7.0
LR6.0
GRA6.0
คลิกข้อความที่ไฮไลต์ในเรียงความเพื่อดูคำแนะนำรายละเอียดเพื่อพัฒนา
การวิเคราะห์เชิงลึก
Task 1 - Academic Writing
4 tools available
บทความตัวอย่าง - IELTS Writing Task 1
ยังไม่มีบทความตัวอย่าง
กดปุ่มด้านล่างเพื่อวิเคราะห์และสร้างบทความตัวอย่างคุณภาพสูงสำหรับ Task 1