
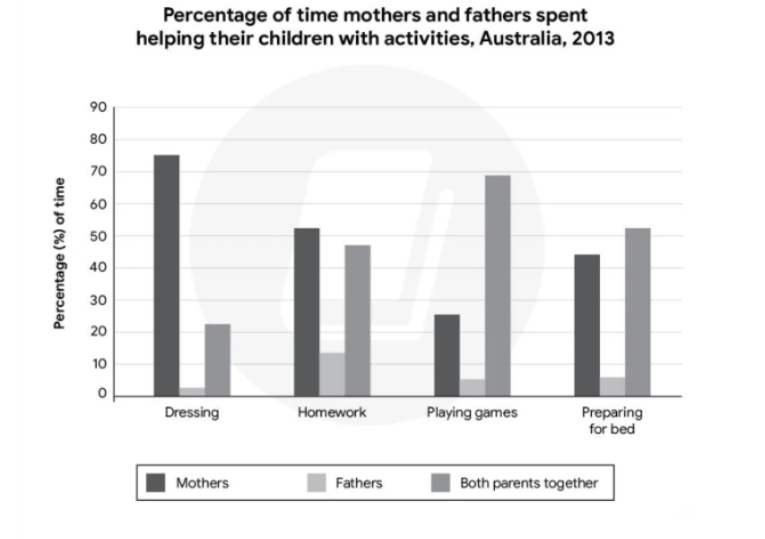
The bar chart illustrates the proportions of time Australian mothers, fathers and both parents together spent assisting their children with four activities in 2013. Overall, mothers devoted the greatest proportion of time to helping their children with dressing and homework, whereas playing games and preparing for bed were more commonly undertaken by both parents together. Moreover, proportions of time spent by fathers were consistently the lowest across all four activities. Turning first to dressing and homework, mothers devoted greater proportions of their time to helping their children with these activities than the other two groups. Regarding dressing, mothers spent approximately three-quarters of their time helping their children, the highest among the three groups. A substantial gap was observed between both parents and fathers, with the corresponding figures standing at around 22% and 2%, respectively. A similar pattern was shown in homework, with mothers' involvement in helping children with this activity constituting standing at around 50%. The figure for both parents stood at around 47%, while that for fathers was approximately 15%. By contrast, playing games and preparing for bed displayed a different pattern, as both parents together dominated these activities. Concerning playing games, both parents together were primarily responsible for assisting children with this activity, accounting for nearly 70% of the total time devoted to it, followed by mothers at around one-quarter, while the figure for fathers was just 5%. Preparing children for bed was another activity dominated by both parents together. Specifically, this group made up approximately 52% of the total time, while the figures for mothers was slightly lower at around 45%, with fathers constituting for only about 5%.
नमूना विवरण
Ex2: The graph below compares the proportion of time Australian parents spent helping their children with different activities in the year 2013.
20/07/2026 17:36 7.0 अंक
विषय
Ex2: The graph below compares the proportion of time Australian parents spent helping their children with different activities in the year 2013.
शब्दों की संख्या: 271
चार्ट/ग्राफ
Essay
समग्र स्कोर
7.0±0.5
अच्छा
राइटिंग मानदंड स्कोर
TA7.0
CC7.0
LR7.0
GRA7.0
सुधार के विस्तृत सुझाव देखने के लिए लेख में किसी भी हाइलाइट किए गए टेक्स्ट पर क्लिक करें।
गहन विश्लेषण
Task 1 - Academic Writing
4 उपकरण उपलब्ध
नमूना लेख - IELTS Writing Task 1
कोई नमूना लेख नहीं
Task 1 के लिए उच्च-गुणवत्ता वाला नमूना लेख विश्लेषण और बनाने के लिए नीचे दिए गए बटन पर क्लिक करें।