
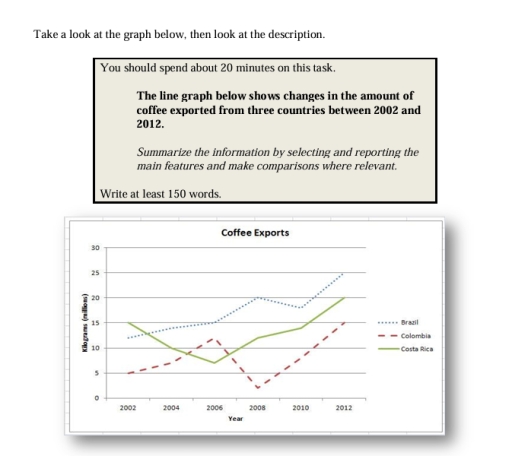
The given line graph illustrates the amount of coffee exports were changed from three countries from 2002 to 2012. Overall, the number of coffee exports from Brazil was highest from two years later to the end of the period , while Colombia is the country where the quantity of coffee exports was lowest at the beginning and end of the period. In the three years later saw a gradual increase in the number of coffee exports in Brazil and Colombia. In the same period, around 8 kilograms of coffee exports declined in Costa Rica. One year later, Brazil overtake Costa Rica as the primary country of coffee exports. From 2008 to 2012, the number of coffee exports from Brazil rose dramatically and reached a peak of some 25 kilograms millions, while Colombia hit a low of only 3 . However, after Colombia touched the bottom lowest during the period, the country was a sharp growth in the number of coffee transfers from around 2 to about 15. By contrast, the figure for Brazil has dropped slightly between 2008 and 2010.
Sample Detail
The line graph below shows changes in the amount of coffee exported from three countries between 2022 and 2012. Summarize the information by selecting and reporting the main features and make comparisons where relevant.
20/07/2026 17:38 5.0 points
Topic
The line graph below shows changes in the amount of coffee exported from three countries between 2022 and 2012. Summarize the information by selecting and reporting the main features and make comparisons where relevant.
Word count: 180
Chart/Graph
Essay
Overall Scores
5.0±0.5
Basic
Writing Criteria Scores
TA5.0
CC5.0
LR5.0
GRA5.0
Click on any highlighted text in the essay to view detailed suggestions for improvement.
Deep Analysis
Task 1 - Academic Writing
4 tools available
Sample Essay - IELTS Writing Task 1
No sample essay
Click the button below to analyze and generate a high-quality sample essay for Task 1.