
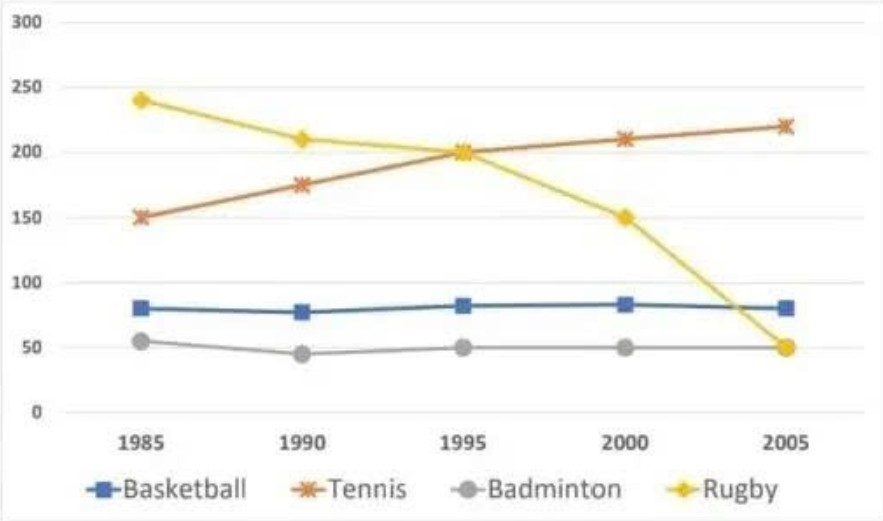
The line graph depicts the number of players in an athletics center in Britain during the period of 1985-2005. Overall, it can be seen that the figure for participants in basketball and badminton remained stagnant throughout the years, while those in tennis grew and rugby decreased over the years. In terms of the two fields that remained unchanged during the period, it was apparent that basketball was the higher. In 1985, there were around 95 people who took part in basketball; however, the figure dropped slightly by 5 figures in the next 5 years. Eventually, the statistics saw a growth back to its starting point at the end of the period. Likewise, badminton had approximately 51 members in the first year of the period, and there was a slight decline in the statistics throughout the next 5 years, ending the period with 50 people in 2005. On the other hand, the statistics for tennis recorded around 150 participants in 1985, before jumping to 220 people at the end of the period. By contrast, the figure for rugby’s enrollment saw an opposite trend by reaching nearly 240 members in 1985 before reducing one fifth of its original statistics at the end of the period.
Sample Detail
The line chart gives information about the participants in a sports center in Britain from 1985 to 2005.
20/07/2026 17:40 6.5 points
Topic
The line chart gives information about the participants in a sports center in Britain from 1985 to 2005.
Word count: 203
Chart/Graph
Essay
Overall Scores
6.5±0.5
Fair
Writing Criteria Scores
TA6.0
CC7.0
LR7.0
GRA7.0
Click on any highlighted text in the essay to view detailed suggestions for improvement.
Deep Analysis
Task 1 - Academic Writing
4 tools available
Sample Essay - IELTS Writing Task 1
No sample essay
Click the button below to analyze and generate a high-quality sample essay for Task 1.